Tariff Update: Incorporating the April 9 Announcements
Additional Resources
- We updated our analysis of how the latest tariff announcements would affect the average effective tariff rate (AETR).
- Following the April 9 announcement, we find that the AETR rises from 22.2 percent in our pre-April 9 analysis to 27.5 percent currently.
- These announcements may have a pronounced effect on specific counties within the Fifth District.
This article updates our previous analysis covering the potential effects of announced tariffs by the U.S. As the analysis is quite similar to our previous analysis, much of the text of the article is drawn from the previous article.
In our April 2 article examining recent tariff announcements, we constructed a benchmark measure of the average effective tariff rate (AETR) based on detailed trade data for 2024. The analysis quantified the fiscal and trade effects of newly proposed tariffs through a series of counterfactual scenarios. These included tariffs on aluminum and steel, renewed duties on Chinese imports, and new levies on products from Canada, Mexico and the European Union (EU). The study showed that the AETR could rise significantly, moving up from a benchmark of 2.3 percent to as high as 15.0 percent under proposed policies.
On April 7, we released an updated article including AETR estimates that incorporated the April 2 announcement of a global tariff plan. This analysis showed that the AETR could rise significantly, moving to about 22 percent under proposed policies.
In this article, we updated the AETR to include the April 9 proposals that largely center around increased tariffs on China and a pause on many tariffs on other countries. Even after accounting for the 90-day pause, the AETR as of April 9 rises to 27.5 percent, higher than our previous calculations on April 7. The movement in the AETR results from changes to the distribution of countries that are going to be subject to tariffs, thus affecting supply chains differently.
The 2025 Tariffs
As of this writing, the following tariff measures — referred to as the January-March 2025 tariffs in our analysis below — are in effect:
- 20 percent tariff on all imports from China, effective Feb. 4 and increased on March 4
- 25 percent tariff on all automobile imports — with an exemption for vehicles meeting U.S. content thresholds and autos and parts exempt from the United States-Mexico-Canada Agreement (USMCA) — announced Feb. 12 and effective April 21
- 25 percent tariff on all aluminum and steel imports, announced Feb. 10 and effective March 12
- 10 percent tariff on Canadian potash and energy, announced Feb. 1 and effective April 2
- 25 percent tariff on all imports from Mexico and on Canadian imports not covered under the USMCA (except for energy and potash from Canada), announced Feb. 1 and effective March 4
The new tariffs announced on April 9 modify these tariffs as follows:
- 10 percent on the countries included in this appendix
- 125 percent to China on goods included in the April 2 announcement
Using the same methodology employed in our original article, we compute the additional tariffs resulting from the April 9 announcement.2 Figure 1 shows how the AETR evolves under recent policy changes from a 2024 baseline of 2.3 percent to 9.9 percent when including the announcements between January and March. The April 9 announcement alone adds an estimated 17.6 percentage points. When all 2025 tariff measures — including the prior announcements — are included, the total AETR for 2025 reaches 27.5 percent.
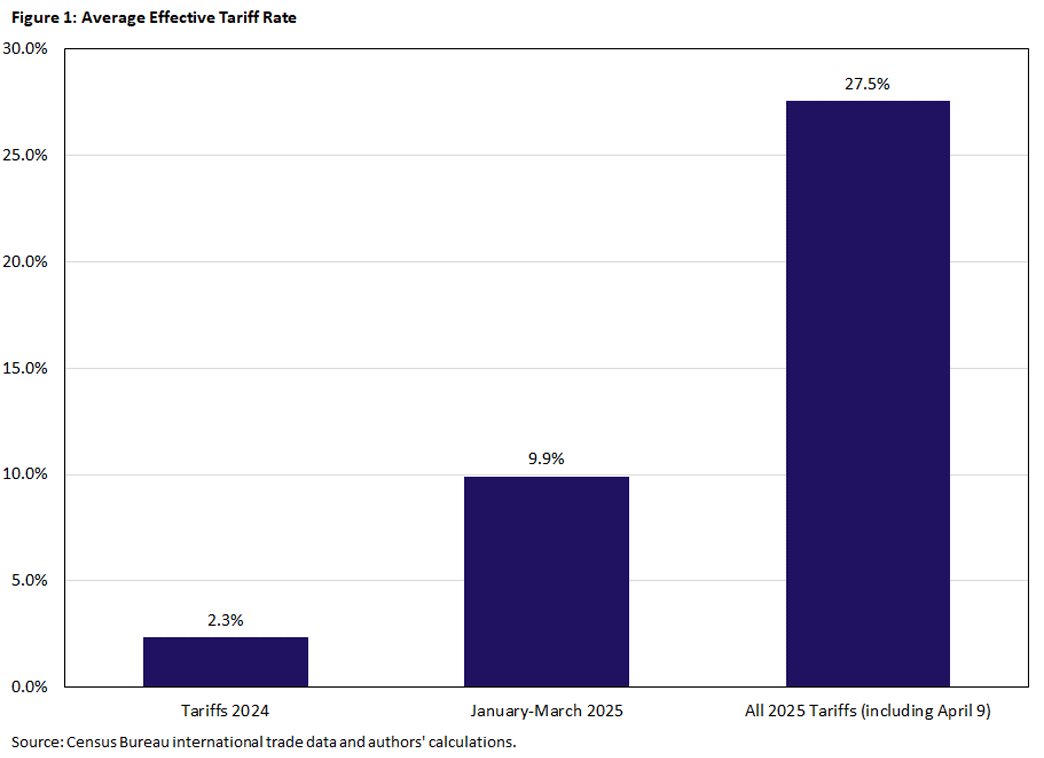
Figure 2 shows that the current tariffs are a marked departure from norms of recent decades, as AETRs had been relatively stable at around 1.7 percent from 2002 to 2024. For context, the AETR in 2017 was 1.4 percent and rose to nearly 3 percent following the tariff actions of 2018-19. In sharp contrast, the 2025 announcements that increase the AETR from 2.3 percent in 2024 to 27.5 percent represent an 18-fold increase and the most significant tariff shock in recent decades.
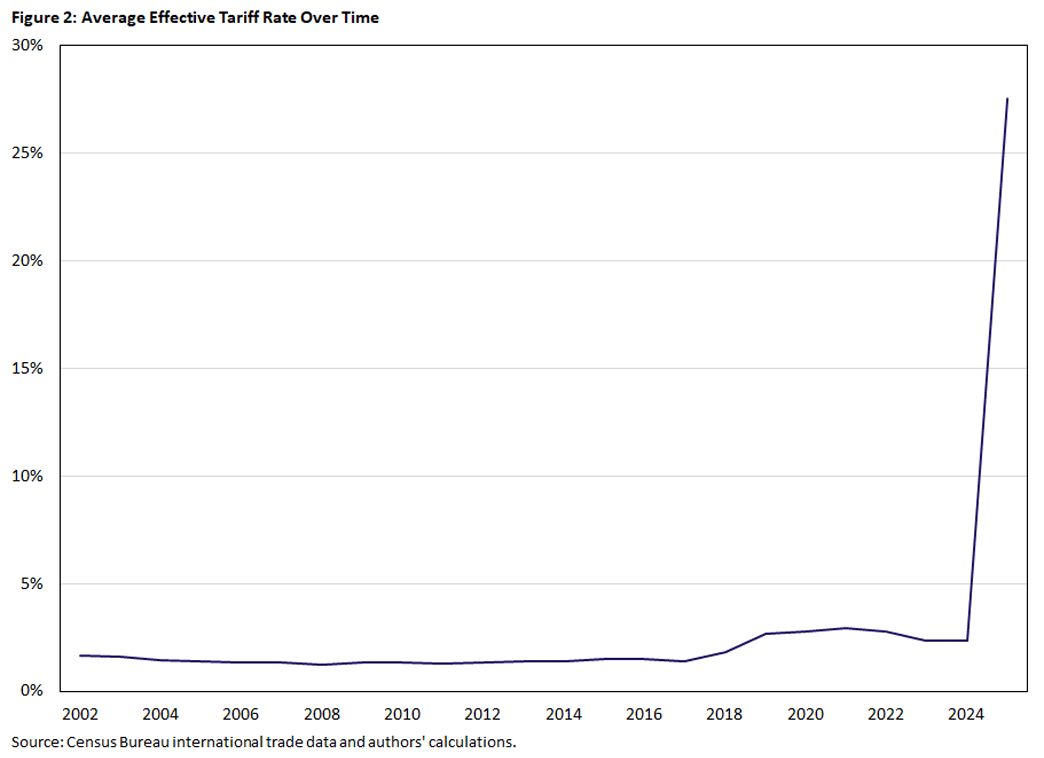
Table 1 presents the AETRs for the U.S.'s largest trading partners and illustrates how the tariff burden varies significantly by partner. It shows the AETR as of 2024, the AETR including the tariffs implemented January-March 2025, and the AETR after incorporating the April 9 policy announcements.
| Origin Country | Import Share | Tariffs 2024 | January-March 2025 | All 2025 Tariffs (Including April 9) |
|---|---|---|---|---|
| EU | 18.5% | 1.2 | 4.4 | 10.0 |
| Mexico | 15.5% | 0.2 | 10.4 | 10.4 |
| China | 13.4% | 10.7 | 31.4 | 135.9 |
| Canada | 12.6% | 0.1 | 8.6 | 8.6 |
| Japan | 4.5% | 1.5 | 10.4 | 15.8 |
| Vietnam | 4.2% | 3.9 | 6.4 | 15.3 |
| South Korea | 4.0% | 0.2 | 10.8 | 15.4 |
| India | 2.7% | 2.4 | 4.1 | 11.2 |
| UK | 2.1% | 1.0 | 6.3 | 12.1 |
| Switzerland | 1.9% | 0.6 | 1.0 | 6.7 |
| Thailand | 1.9% | 1.6 | 3.9 | 12.6 |
| Malaysia | 1.6% | 0.6 | 3.5 | 10.2 |
| AETR | 100.0% | 2.3 | 9.9 | 27.5 |
In 2024, AETRs ranged from near zero (such as the rates for Canada and Mexico under USMCA) to over 10 percent for China, which remained subject to Section 301 tariffs imposed in 2018-19. Following the April 9 announcement — which imposed a minimum 10 percent tariff on most trading partners with higher rates for China — AETRs increased across the board.
The columns capture the effects of all tariffs implemented or announced this year. Countries like China, Japan, South Korea and Vietnam now face effective tariff rates above 15 percent. While traditional trade partners such as the EU, Canada and Mexico see smaller increases in absolute terms (rising to between 8.5 and 11 percent), their effective rates have jumped significantly from near-zero levels in 2024, representing some of the largest percentage increases overall.
China in particular sees a massive increase in AETR to 135.9 percent. This rise incorporates the 2018-19 tariffs, those announced between January and March (additional 20 percent, and those on aluminum, steel and autos), as well as the most recent announcement on April 9 of 125 percent. The increase is not linear because not all goods are subject to the tariffs mentioned above: For example, tariff rates on copper, pharmaceuticals, semiconductors, lumber, energy and critical minerals will be announced later.
Figure 3 illustrates the tariff burden across sectors under the full set of 2025 tariffs, including the April 9 measures. Sectors are in increasing order by their AETR, highlighting the disproportionate impact on industries like textiles, agricultural support activities, textile mills, leather and apparel, which are more reliant on imports from China.3
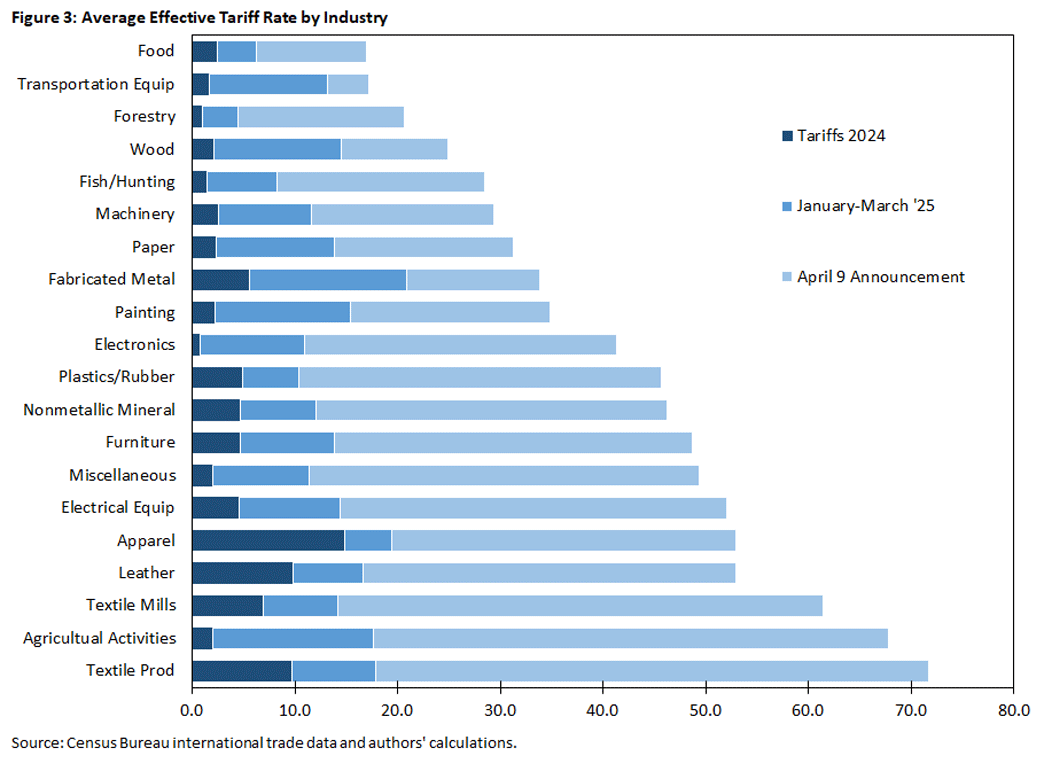
Note that the increase in transportation equipment is smaller than previous estimates following the announcement that auto parts in the U.S. (as well as those under USMCA agreement) are not subject to tariffs from Canada and Mexico.
Figure 4 illustrates a notable increase in tariff exposure across U.S. counties when moving from Scenario 1 (which includes announcements between January and March 2025) to Scenario 2 (which includes the April 9 announcements). In Scenario 1, most counties exhibit relatively low tariff exposure, predominantly between zero percent and 3 percent, reflecting the baseline tariffs already in place as of December 2024. Only a few isolated counties show higher exposure.
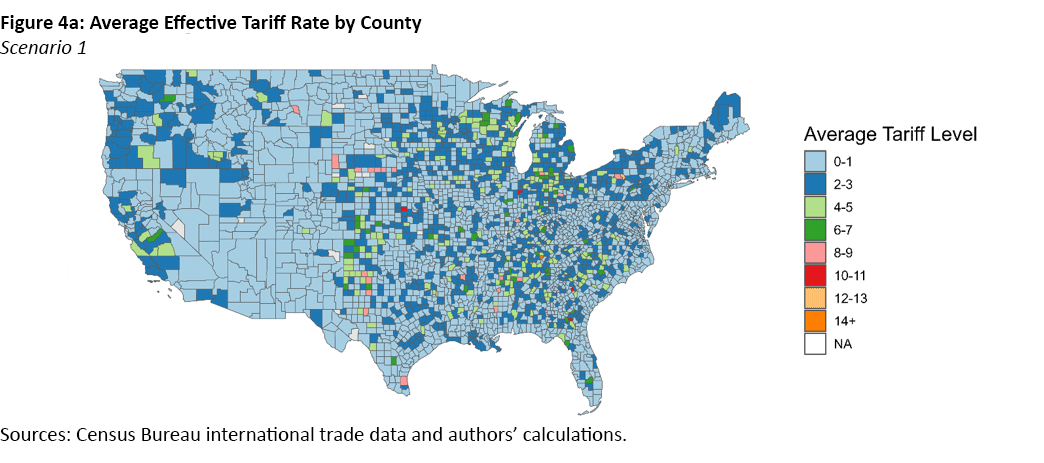
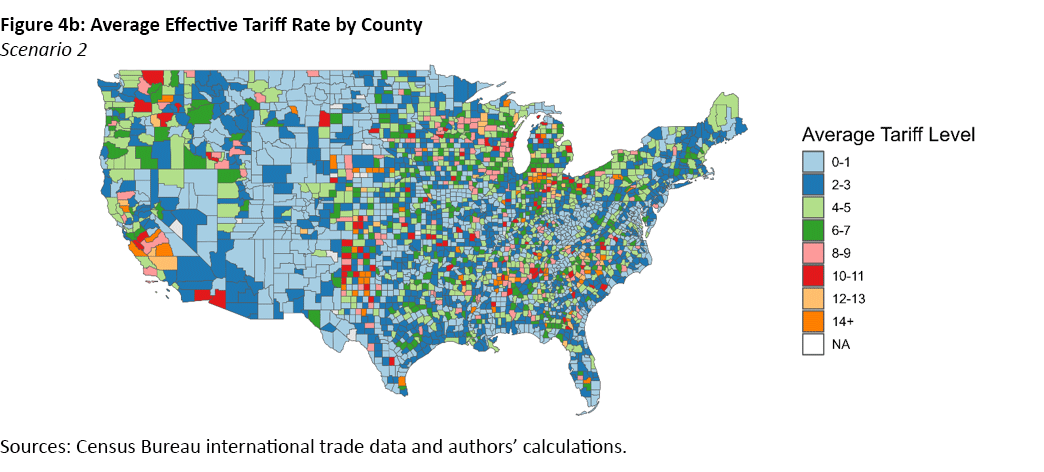
The counties most severely impacted under Scenario 2 highlight the significant regional variation in tariff exposure across the U.S., largely driven by the specific industry composition of local employment. Counties exhibiting notably high average tariff rates include:
- Quitman, Gordon, Murray and Whitfield in Georgia
- Pontotoc, Choctaw and Calhoun in Mississippi
- Van Buren in Tennessee
- Briscoe and Cochran in Texas
- Glades in Florida
- Cameron in Pennsylvania
- Adams in Washington
- Madera in California
These counties share a heavy reliance on industries directly impacted by higher tariffs, including textile manufacturing, furniture production, fabricated metals, wood products, miscellaneous manufacturing and agricultural support activities.
For example, Van Buren County in Tennessee faces significant tariff exposure due to its employment concentration in fabricated metal and wood product manufacturing, resulting in a notably high tariff burden (25 percent). Similarly, counties like Gordon and Murray in Georgia — with large shares of employment in textile mills and products — also experience substantial tariff exposure (around 25 percent to 27 percent). Agricultural regions such as Briscoe and Cochran counties in Texas and Adams County in Washington see pronounced impacts due to tariffs on agricultural support activities and crop production.
Counties within the Federal Reserve Bank of Richmond's Fifth District — which includes Maryland, North Carolina, South Carolina, Virginia, Washington, D.C., and most of West Virginia — also exhibit significant exposure under Scenario 2, as shown in Figure 4c.
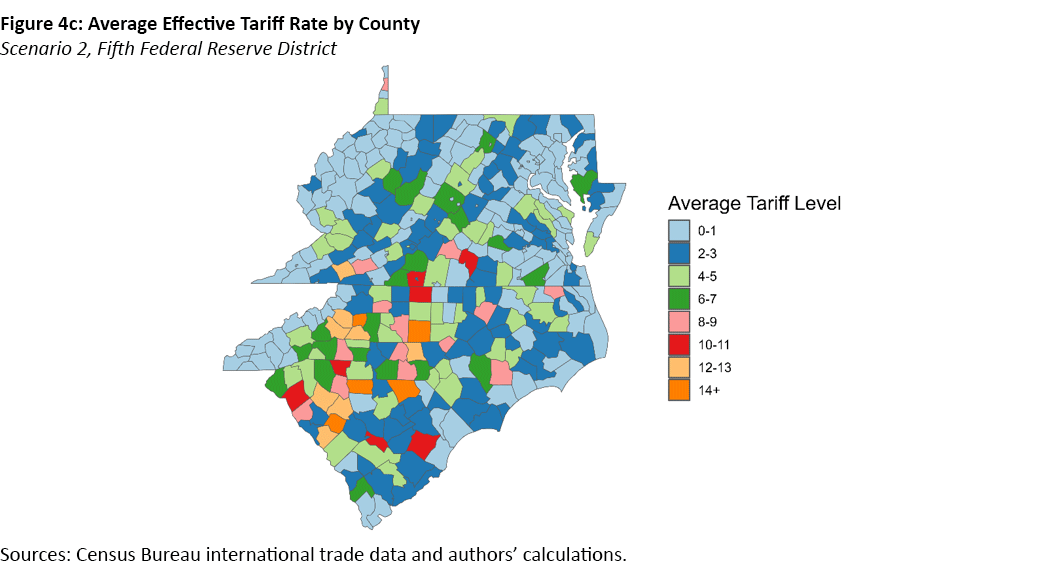
Alexander County in North Carolina experiences the highest exposure, with an AETR of approximately 22.5 percent, largely driven by its concentration in furniture and related-product manufacturing, as well as plastics and rubber manufacturing. North Carolina counties such as Randolph, Burke, Catawba, Montgomery and Caldwell also face elevated tariff rates, ranging from about 11.6 percent to 14.7 percent and reflecting their reliance on industries like furniture manufacturing, food services and wood products.
South Carolina counties are similarly affected. Chesterfield, Saluda, Chester, Edgefield, Newberry, Laurens, Calhoun and Williamsburg counties have AETRs ranging from around 10.7 percent to 14.1 percent. Chesterfield County's high exposure (14.1 percent) is linked to its employment concentration in fabricated metal products. Counties such as Chester and Laurens face tariff exposure through plastics and rubber.
Summary
This analysis provides a potentially valuable but necessarily imperfect measure of county-level tariff exposure. The county AETR is calculated by weighting industry-specific tariff rates according to each industry's share of total employment within the county. While this approach captures local economic specialization, it does not account for critical factors such as the specific proportion of each industry's production costs attributable to imports or the extent of firm or establishment reliance on foreign suppliers. These missing details represent important caveats, as industries with similar employment levels could differ considerably in their actual vulnerability to tariff increases depending on their specific sourcing strategies and cost structures. Thus, while these estimates are indicative of potential exposure, they should be interpreted with caution, recognizing these limitations.
Marina Azzimonti is a senior economist and research advisor, Zachary Edwards is a research analyst, Sonya Waddell is a vice president and economist, and Acacia Wyckoff is a research associate, all in the Research Department at the Federal Reserve Bank of Richmond.
This analysis accounts for exemptions under the USMCA for certain Canada and Mexico trade, as well as exclusions for U.S.-origin content in foreign-produced automobiles.
The April 2 and April 9 tariff packages cover most imported goods but excludes products that are already subject to separate tariff measures earlier in the year — namely steel, aluminum and automobiles — as well as copper, pharmaceuticals, semiconductors, lumber, energy and critical minerals. Our current analysis excludes these carved-out categories.
The effective tariff rate on transportation equipment did not rise as sharply as initially projected in our previous article. This is due to the clarification in the April 2 announcement that auto-related goods from Canada and Mexico falling under USMCA provisions would be exempt from the 25 percent tariff.
To cite this Economic Brief, please use the following format: Azzimonti, Marina; Edwards, Zachary; Waddell, Sonya; and Wyckoff, Acacia. (April 2025) "Tariffs Update: Incorporating the April 9 Announcements." Federal Reserve Bank of Richmond Economic Brief, No. 25-15.
This article may be photocopied or reprinted in its entirety. Please credit the authors, source, and the Federal Reserve Bank of Richmond and include the italicized statement below.
Views expressed in this article are those of the authors and not necessarily those of the Federal Reserve Bank of Richmond or the Federal Reserve System.
Receive a notification when Economic Brief is posted online.