Tariffs Update: Potential Effects of the April 2 Announcements
Key Takeaways
- Our previous article presented a benchmark measure of the average effective tariff rate (AETR) based on detailed trade data for 2024.
- Prior to the April 2 announcement of a global tariff plan, we found that AETR could rise from 2.2 percent to 15.0 percent under proposed policies.
- Once the April 2 plan is incorporated into our analysis, the AETR reaches 22.2 percent.
Our previous article presented a benchmark measure of the average effective tariff rate (AETR) based on detailed trade data for 2024. The analysis quantified the fiscal and trade effects of newly proposed tariffs through a series of counterfactual scenarios. These included tariffs on aluminum and steel, renewed duties on Chinese imports, and new levies on products from Canada, Mexico and the European Union (EU). The study showed that the AETR could rise significantly, moving up from a benchmark of 2.3 percent to as high as 15.0 percent under proposed policies.
In this article, we build on this framework by incorporating the April 2 announcement of a global tariff plan.
The 2025 Tariffs
As of this writing, the following tariff measures — referred to as the January-March 2025 tariffs in our analysis below — are in effect:
- 20 percent tariff on all imports from China, effective Feb. 4 and increased on March 4
- 25 percent tariff on all automobile imports — with an exemption for vehicles meeting U.S. content thresholds and autos and parts exempt from the United States-Mexico-Canada Agreement (USMCA) — announced Feb. 12 and effective April 2.1
- 25 percent tariff on all aluminum and steel imports, announced Feb. 10 and effective March 12
- 10 percent tariff on Canadian potash and energy, announced Feb. 1 and effective April 2
- 25 percent tariff on all imports from Mexico and on Canadian imports not covered under the USMCA (except for energy and potash from Canada), announced Feb. 1 and effective March 4
Following these measures were an additional set of tariffs announced on April 2.2 These newly announced measures consisted of a minimum 10 percent tariff on all imports from countries outside of Canada and Mexico, with higher rates for about 60 countries (details in the appendix).
Using the same methodology employed in our previous article, we compute the additional tariffs resulting from the April 2 announcement. Figure 1 shows how the AETR evolves under recent policy changes: Starting from a 2024 baseline of 2.3 percent, the April 2 announcement alone adds an estimated 11.1 percentage points. When all 2025 tariff measures are included — including the prior announcements — the total AETR for 2025 reaches 22.2 percent.
Figure 2 shows that the current tariffs are a marked departure from norms of recent decades, as AETRs had been remaining relatively stable at around 1.7 percent from 2002 to 2024. For context, the AETR in 2017 was 1.4 percent and rose to nearly 3 percent following the tariff actions of 2018-19. In sharp contrast, the 2025 announcements increase the AETR from 2.3 percent in 2024 to 22.2 percent, representing a 15-fold increase and the most significant tariff shock in recent decades.
Table 1 presents the AETRs for the U.S.'s largest trading partners. It shows the AETR as of 2024, the additional impact of the April 2 policy announcement and the resulting total AETR in 2025.
| Origin Country | Import Share | Tariffs 2024 | April 2 Only | All 2025 Tariffs |
|---|---|---|---|---|
| EU | 18.5 | 1.2 | 11.2 | 15.6 |
| Mexico | 15.5 | 0.2 | 0.0 | 15.5 |
| China | 13.4 | 10.7 | 22.8 | 54.1 |
| Canada | 12.6 | 0.1 | 0.0 | 11.9 |
| Japan | 4.5 | 1.5 | 4.3 | 23.4 |
| Vietnam | 4.2 | 3.9 | 40.9 | 47.3 |
| South Korea | 4.0 | 0.2 | 11.4 | 22.2 |
| India | 2.7 | 2.4 | 18.5 | 22.5 |
| UK | 2.1 | 1.0 | 5.7 | 12.1 |
| Switzerland | 1.9 | 0.6 | 17.7 | 18.7 |
| Thailand | 1.9 | 1.6 | 31.3 | 35.2 |
| Malaysia | 1.6 | 0.6 | 16.2 | 19.7 |
| AETR | 100.0 | 2.3 | 11.3 | 22.2 |
Table 1 illustrates how the tariff burden varies significantly by trading partner. In 2024, AETRs ranged from near zero (such as the rates for Canada and Mexico under USMCA) to over 10 percent (for China, which remained subject to preexisting Section 301 tariffs imposed in 2018-19).
Following the April 2 announcement — which imposed a minimum 10 percent tariff on most trading partners with higher rates for selected countries — AETRs increase across the board. The final column shows the cumulative 2025 AETR by country, capturing the effects of all tariffs implemented or announced this year. Countries like Vietnam, China and Thailand now face effective tariff rates above 30 percent. While traditional trade partners such as the EU, Canada and Mexico see smaller increases in absolute terms (rising to between 10 and 15 percent), their effective rates have jumped significantly from near-zero levels in 2024, representing some of the largest percentage increases overall.
Figure 3 illustrates the tariff burden across sectors under the full set of 2025 tariffs, including the April 2 measures. Sectors are in increasing order by their AETR, highlighting the disproportionate impact on industries like leather, apparel and furniture, which are more reliant on imports from countries facing elevated tariff rates.3
The effective tariff rate on transportation equipment did not rise as sharply as initially projected in our previous article. This is due to the clarification in the April 2 announcement that auto-related goods from Canada and Mexico falling under USMCA provisions would be exempt from the 25 percent tariff.
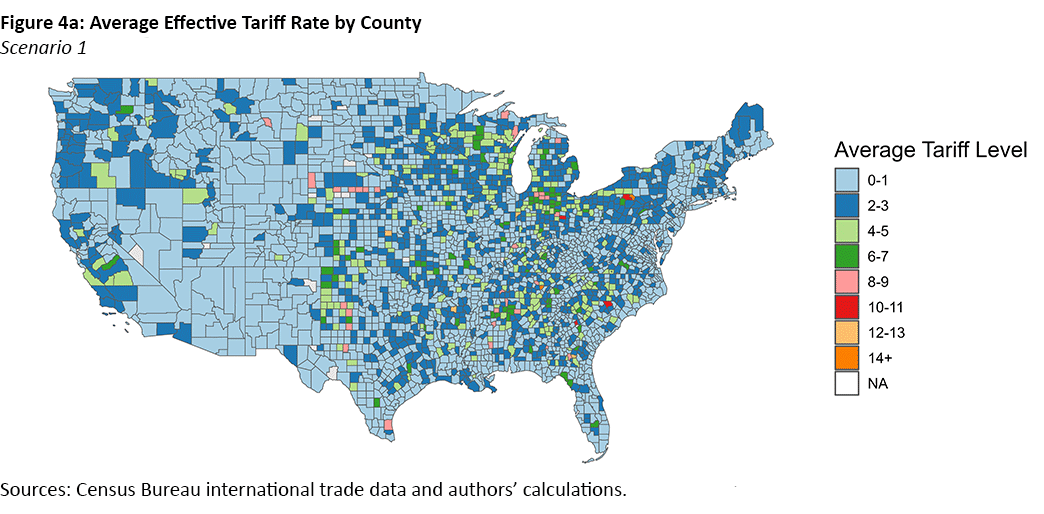
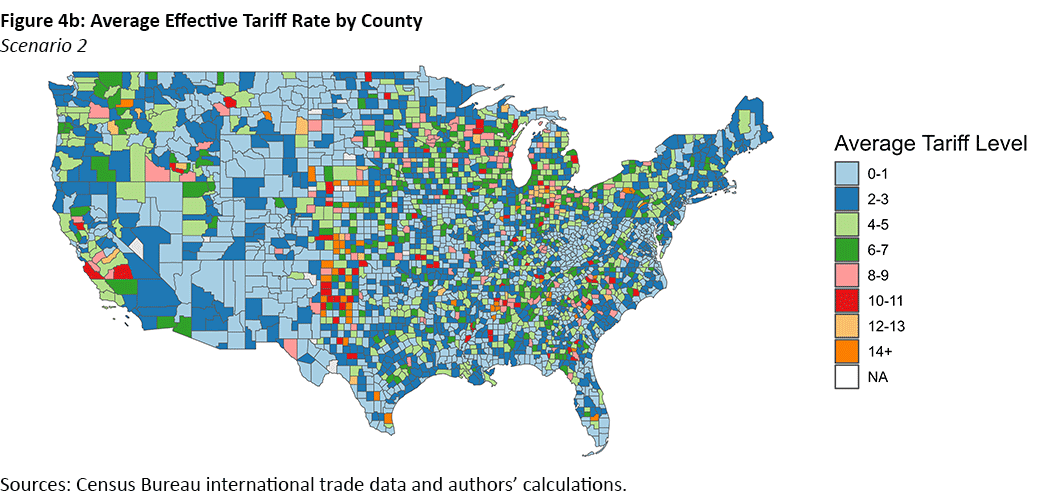
Figure 4 displays the AETR by county using the same methodology as in the previous EB, but including the January-March 2025 tariffs (Figure 4a) and those plus the ones announced on April 2 (Figure 4b). Comparing the two figures underscores the breadth of regions that would be impacted by these new tariffs that are scheduled to take effect on April 9.
Editor's Note: Figure 3 has been updated to accurately reflect the proper industries.
This analysis accounts for exemptions under the USMCA for certain Canada and Mexico trade, as well as exclusions for U.S.-origin content in foreign-produced automobiles.
The April 2 tariff package covers most imported goods but excludes products that are already subject to separate tariff measures earlier in the year — namely steel, aluminum and automobiles — as well as copper, pharmaceuticals, semiconductors, lumber, energy and critical minerals. Our current analysis excludes these carved-out categories.
The effective tariff rate on transportation equipment did not rise as sharply as initially projected in our previous article. This is due to the clarification in the April 2 announcement that auto-related goods from Canada and Mexico falling under USMCA provisions would be exempt from the 25 percent tariff.
To cite this Economic Brief, please use the following format: Azzimonti, Marina; Edwards, Zachary; Waddell, Sonya; and Wyckoff, Acacia. (April 2025) "Tariffs Update: Potential Effects of the April 2 Announcements." Federal Reserve Bank of Richmond Economic Brief, No. 25-13.
This article may be photocopied or reprinted in its entirety. Please credit the authors, source, and the Federal Reserve Bank of Richmond and include the italicized statement below.
Views expressed in this article are those of the authors and not necessarily those of the Federal Reserve Bank of Richmond or the Federal Reserve System.
Receive a notification when Economic Brief is posted online.