Tariff Vibes: Not Like Last Time
One way to forecast the potential economic effects of the recently proposed tariffs is to benchmark against historical episodes of tariff increases, with the most recent being in 2018-19. However, there are significant differences between this time and last time, including the size of the tariff hikes, the range of countries and products on which they are assessed, and the reaction of consumers. This week's post will illustrate how household sentiment related to tariffs has differed between 2018 and 2025.
To explore these differences, I looked at monthly responses to the University of Michigan's Surveys of Consumers, examining a window of three months before and after the first tariff actions of 2018 and 2025. For 2018, this corresponds to the imposition of 30 percent to 50 percent tariffs on solar panels and washing machines that January. For 2025, this corresponds to the initial announcement of 25 percent tariffs on Canadian and Mexican imports and 10 percent tariffs on Chinese imports in February.
I focus on a subset of questions where tariffs could potentially affect household sentiment — namely, the share of survey respondents who think it is a good time to buy large household durables and vehicles because prices will increase — as well as one-year and five-year expectations for inflation. To illustrate differences in the change in sentiment over time, I normalize each index to 100 three months prior to the first tariff action and compare the 2018 index to the 2025 index. Because the survey data are only available through March 2025, the 2025 index only extends through a single month after the first tariff action.
Despite still being in the early stages of the 2025 tariff rollout, preliminary evidence indicates larger changes in consumer sentiment following tariff developments compared to 2018.
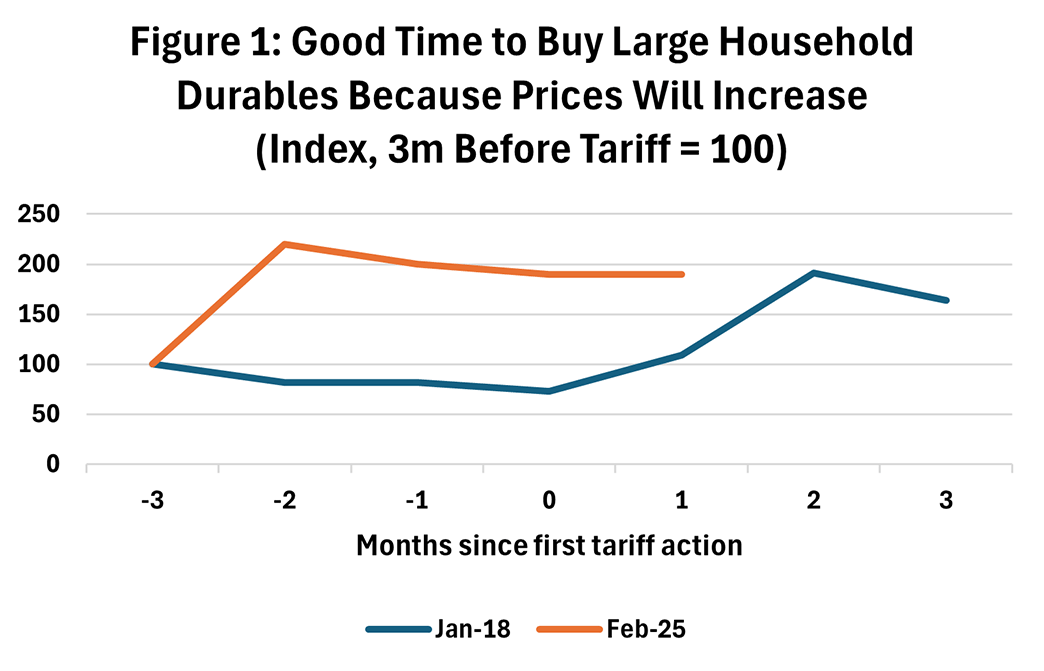
Figure 1 shows that consumers may be more willing now to pull ahead purchases of large household durables than they were in 2018. The graph below shows the index (normalized to 100 at the beginning of the event window) for the share of respondents who said it was a good time to buy big ticket items because prices would increase.
In the three months leading up to the initial 2018 tariff announcement, there was little change in the index. Following the announcement of tariffs, there was a gradual increase in the share of respondents saying it was a good time to purchase household durables due to the prospect of rising prices.
In contrast, in the three months prior to the 2025 tariff rollout, there was a bigger increase in the share of respondents who said it was a good time to purchase durables due to rising prices. Furthermore, that share has continued to remain elevated one month after the first tariff announcement. The earlier increase in positive responses in 2025 compared to 2018 may reflect differences in the degree to which tariff announcements were considered a surprise. That is, 2025's tariff actions may have been telegraphed earlier and were thus less surprising than the tariff hikes of 2018.
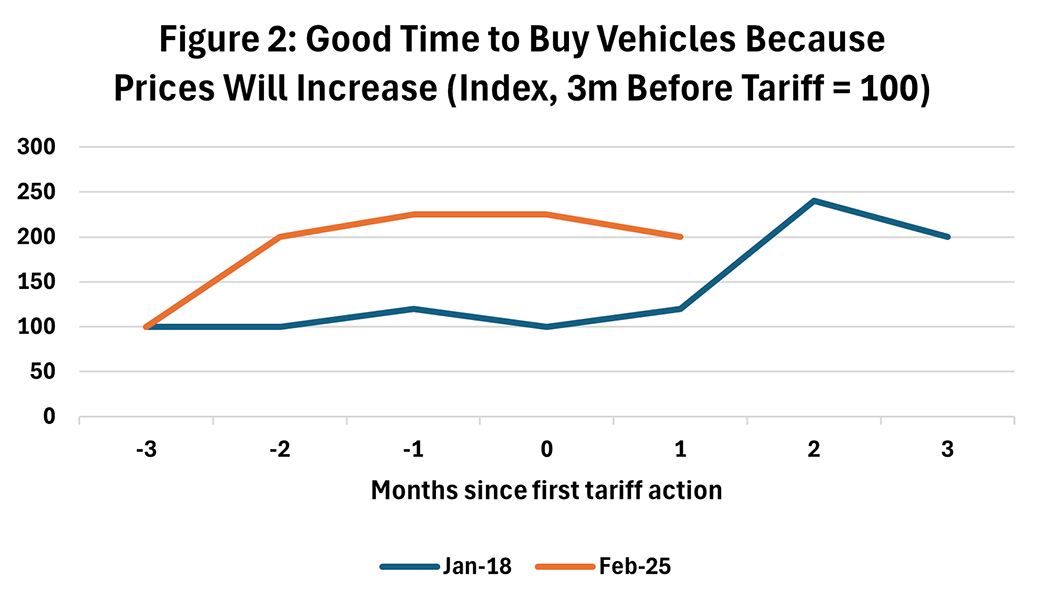
The survey shows a similar dynamic for households' willingness to buy vehicles, which can be seen in the indexed survey responses plotted in Figure 2. In the three months leading up to the first 2018 tariff announcement, there was little change in share of respondents who said it was a good time to buy vehicles because prices would increase. Following the initial announcement, the share of respondents responding positively to the survey increased.
In contrast, three months prior to the 2025 tariff rollout, there was a noticeable increase in the share of respondents who said it was a good time to purchase vehicles due to rising prices. One month after the tariff announcement, the share of positive respondents remained at the elevated level.
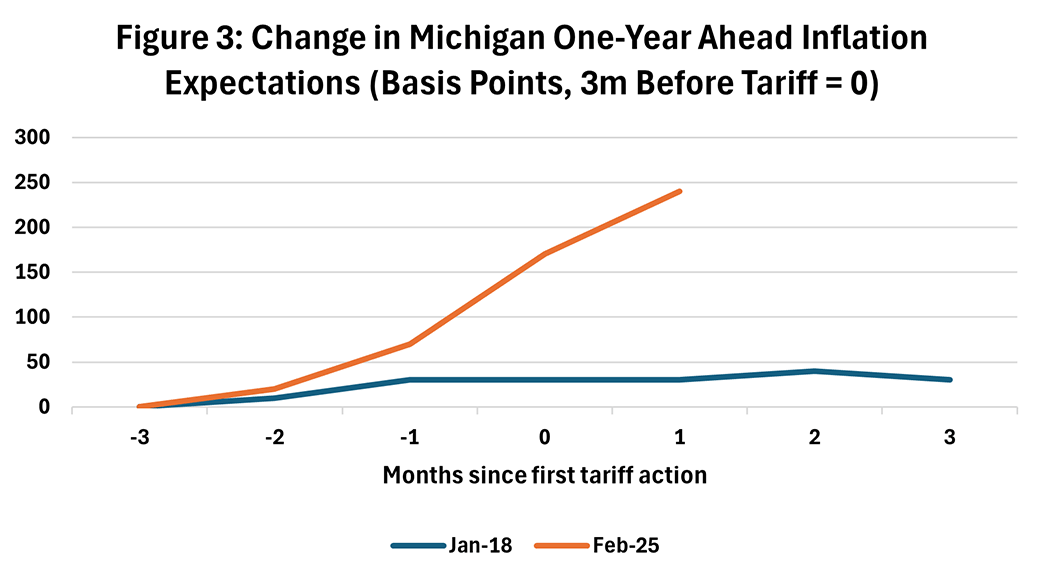
Compared to the 2018 tariff rollout, households' inflation expectations have increased much more steeply this time. Figure 3 shows changes in year-ahead inflation expectations according to the Michigan survey over the six-month interval surrounding the tariff rollouts. In 2018, inflation expectations were largely unchanged over that period. In contrast, in 2025, inflation expectations increased steadily over the three months prior to the tariff action, with the upward trend continuing one month after the first tariff announcements.
Table 1 reports the nonindexed median year-ahead inflation expectations from the survey. The year-ahead inflation expectation of 5.0 percent recorded in March was the highest since November 2022.
| Months Since First Action | -3 | -2 | -1 | 0 | 1 | 2 | 3 |
|---|---|---|---|---|---|---|---|
| Jan-18 | 2.4 | 2.5 | 2.7 | 2.7 | 2.7 | 2.8 | 2.7 |
| Feb-25 | 2.6 | 2.8 | 3.3 | 4.3 | 5.0 | ||
| Source: University of Michigan | |||||||
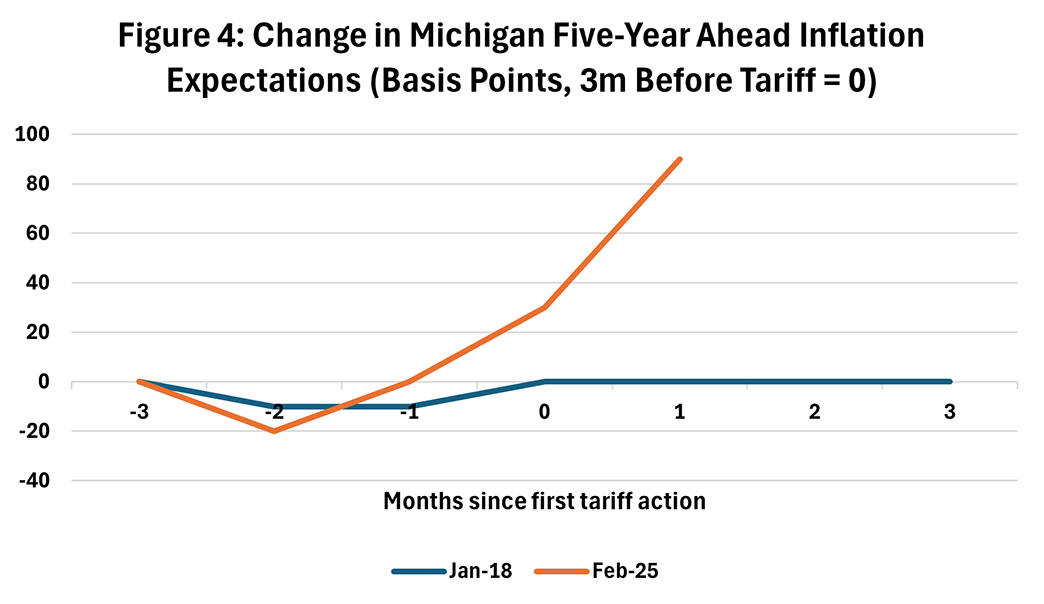
Similar to the one-year inflation expectations, households' longer-run inflation expectations have increased more steeply in the 2025 tariff rollout compared to 2018. Figure 4 shows that longer-run inflation expectations in 2018 were largely unchanged over the six-month interval surrounding the first tariff rollout. In contrast, in the 2025 tariff episode, longer-run inflation expectations increased in the month additional tariffs were announced and rose even further the following month.
Table 2 reports the nonindexed median five-year inflation expectations in the survey. Long-run inflation expectations rose from 3.5 percent in February to 4.1 percent in March, reaching its highest level since February 1993.
| Months Since First Action | -3 | -2 | -1 | 0 | 1 | 2 | 3 |
|---|---|---|---|---|---|---|---|
| Jan-18 | 2.5 | 2.4 | 2.4 | 2.5 | 2.5 | 2.5 | 2.5 |
| Feb-25 | 3.2 | 3 | 3.2 | 3.5 | 4.1 | ||
| Source: University of Michigan | |||||||
What does the larger reaction of household sentiment to tariffs mean for the economy? As discussed in a previous Macro Minute post, spending behavior isn't always tightly linked to spending sentiment, so it's unclear whether household spending data will reveal a burst of pre-tariff stockpiling.
Another Macro Minute post discussed how the recent rise in inflation expectations in the Michigan survey isn't as apparent in other measures of inflation expectations. Nevertheless, anchored long-run inflation expectations are a key feature of price stability. As noted in the Fed's 2020 Statement on Longer-Run Goals and Monetary Policy Strategy, "longer-term inflation expectations that are well anchored at 2 percent foster price stability and moderate long-term interest rates and enhance the Committee's ability to promote maximum employment." In that context, the heightened sensitivity of households' long-run inflation expectations to tariff developments is something that bears careful watching.
Views expressed in this article are those of the author and not necessarily those of the Federal Reserve Bank of Richmond or the Federal Reserve System.


