Inflation Uncertainty Unusually Escalated
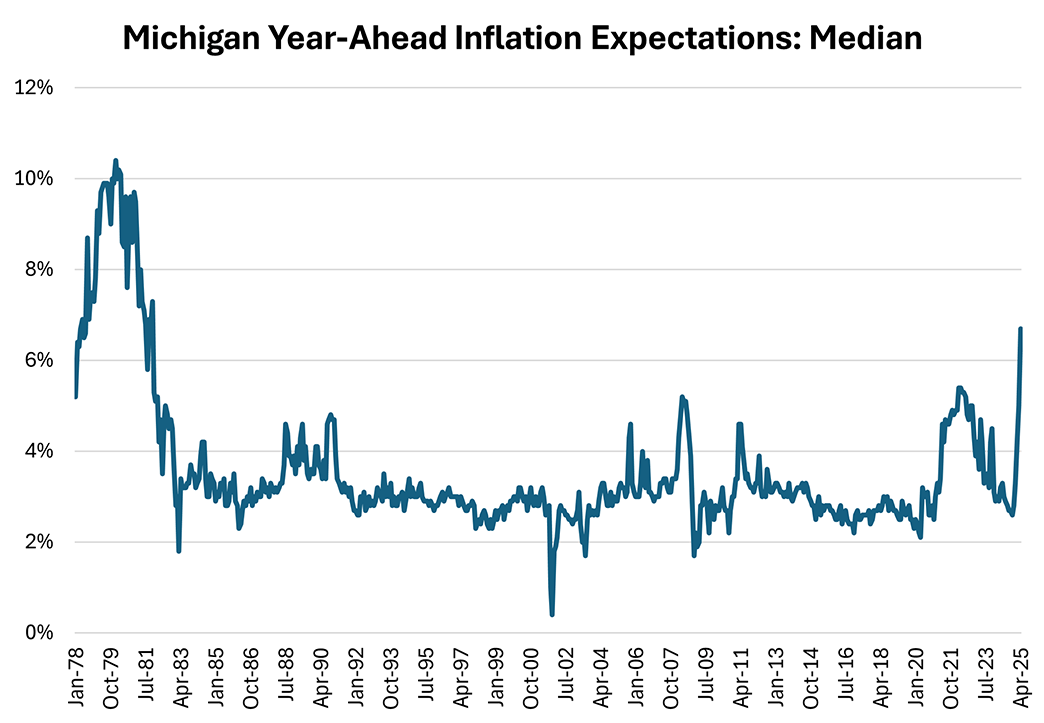
In a recent Macro Minute post, I discussed how the University of Michigan's survey-based inflation expectations measure had increased through February. Since that post, preliminary data for the month of April were released, and they indicate that the upward trend in expected inflation continues. (The finalized April reading will be released on April 25, after this post is published). Median year-ahead inflation expectations increased to 6.7 percent in the preliminary April reading, up from 5.0 percent in March and reaching their highest level since November 1981 (Figure 1).
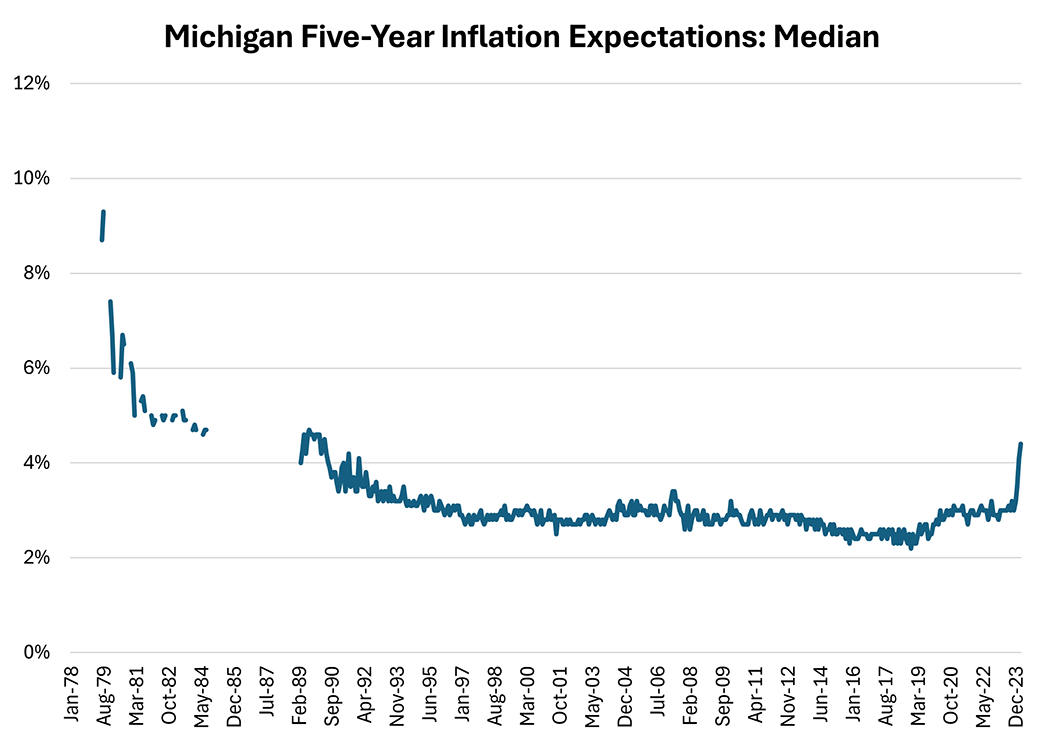
Longer-run inflation expectations also rose in the preliminary April reading, up to 4.4 percent in April from 4.1 percent in May and reaching their highest level since June 1991 (Figure 2).
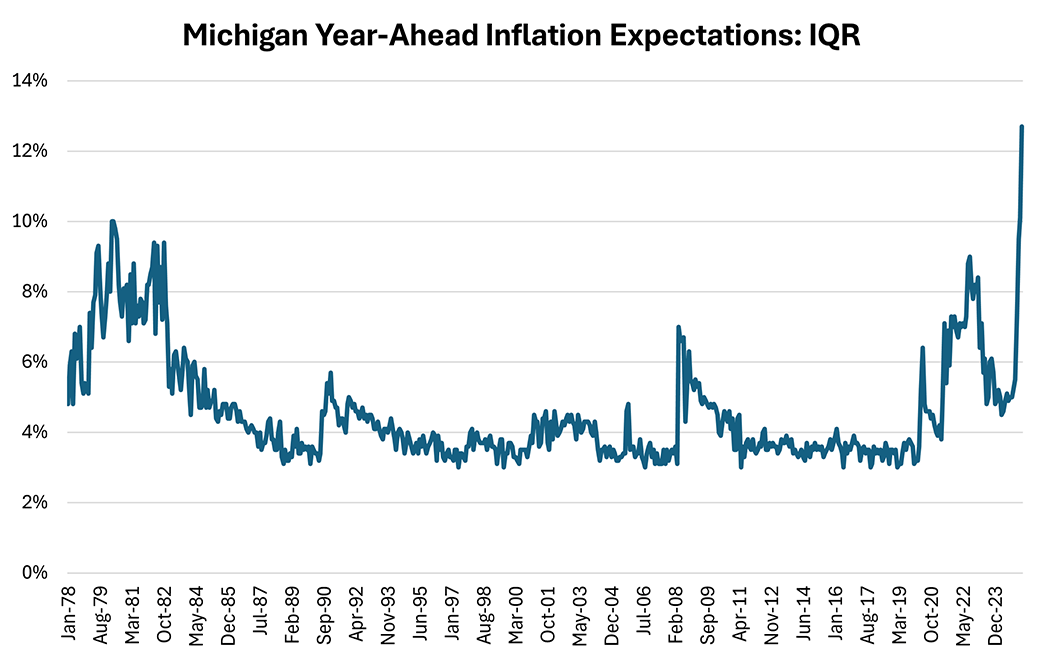
The survey also reveals that uncertainty about inflation has increased in the near term. One measure of inflation uncertainty (or disagreement about the inflation outlook) is the interquartile range (IQR) of forecasts, which is computed as the 75th percentile of survey responses minus the 25th percentile. While this disagreement could reflect differences in forecasters' assumptions about the economy, it could also be due to significant differences across political affiliation. The IQR is plotted in Figure 3: At 12.7 percentage points in April's preliminary reading, the IQR of year-ahead inflation expectations has reached its highest level since at least January 1978, the farthest back the survey data go.
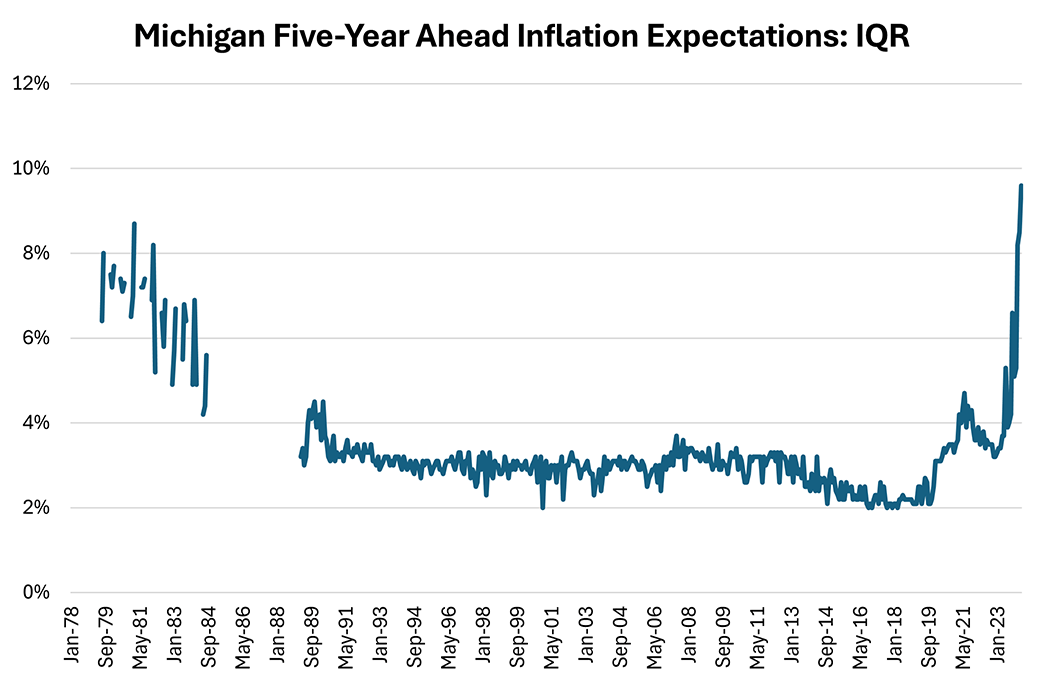
The rise in disagreement is also evident for longer-run inflation expectations, with the IQR of five-year inflation expectations rising to 9.6 percentage points in April's preliminary reading (Figure 4). Similar to the reading for year-ahead inflation expectations, this is the highest reading since the beginning of the survey data (February 1979). Research by Ricardo Reis, a Richmond Fed long-term consultant, indicates that rising disagreement on the long-run inflation outlook as captured by the cross-sectional distribution of expectations can be a symptom of a drift in the anchor for long-run inflation expectations.
As noted in our previous post on inflation expectations, anchored long-run inflation expectations help monetary policy to achieve its objective of stable inflation. In a 2023 speech, Richmond Fed President Tom Barkin noted the dispersion of inflation expectations as a reason for caution about the inflation outlook. Since that speech was given, recent survey data suggest even greater risks to the anchoring of households' longer-term inflation expectations, so caution may be especially warranted today.
Views expressed in this article are those of the author and not necessarily those of the Federal Reserve Bank of Richmond or the Federal Reserve System.