Sectoral Determinants of Aggregate Productivity Growth
Key Takeaways
- Understanding the aggregate behavior of productivity growth requires examining the behavior of each sector's productivity growth.
- The middling performance of services productivity and the sector's increasing share of the economy are responsible for the subpar aggregate productivity growth.
- We should expect little to no help from AI to make the aggregate economy more productive.
Aggregate labor productivity growth — defined here as the year-over-year growth rate of output per hour of work — is a critical economic indicator. A 2024 working paper notes that growth in aggregate labor productivity not only drives per-capita income growth but also reflects productivity changes across all sectors of the economy.1
Given its importance, the postwar behavior of aggregate labor productivity growth in the U.S. has been extensively studied. Our previous article, for example, documented and summarized possible explanations for its gradual decline over time.2 Building on this foundation, this article and analysis now examines the role that different sectors of the economy have played in determining aggregate labor productivity growth.
Aggregate Productivity and Structural Change
We consider the behavior of labor productivity growth from 1947-2021. Figure 1 shows that aggregate labor productivity growth was higher in the period from 1947-1987 than afterward. Starting at a 2 percent growth rate from our initial data point of 1947-1948 (labeled as 1948 in the figure), labor productivity growth peaked at 5.2 percent in 1950 and bottomed at -0.17 percent in 1982. The average growth rate of labor productivity was 1.9 percent over the entire the postwar period, falling from an average of 2.3 percent from 1947-1987 to an average of 1.4 percent from 1988-2021.
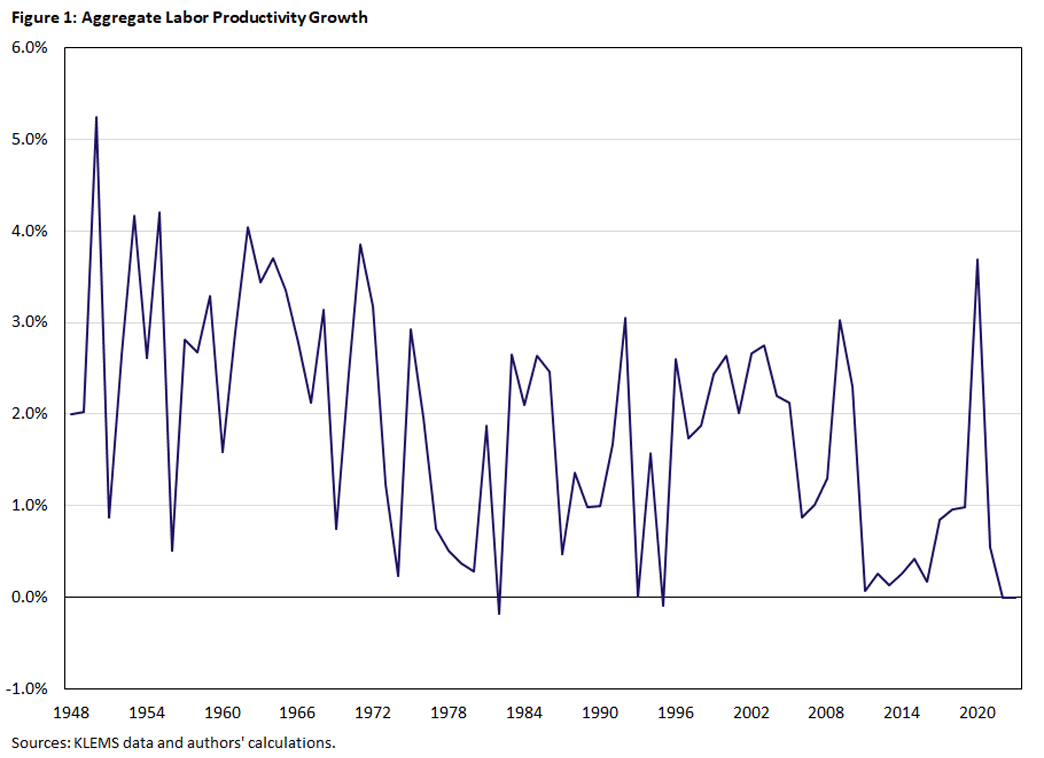
Figure 2 decomposes labor productivity into total factor productivity (TFP) and capital deepening:
- TFP measures how efficiently inputs are used to produce output.
- Capital deepening measures how much capital per worker exists in the economy.
The figure shows that TFP has become more stagnant the longer the postwar period extends, while capital deepening has become more volatile.
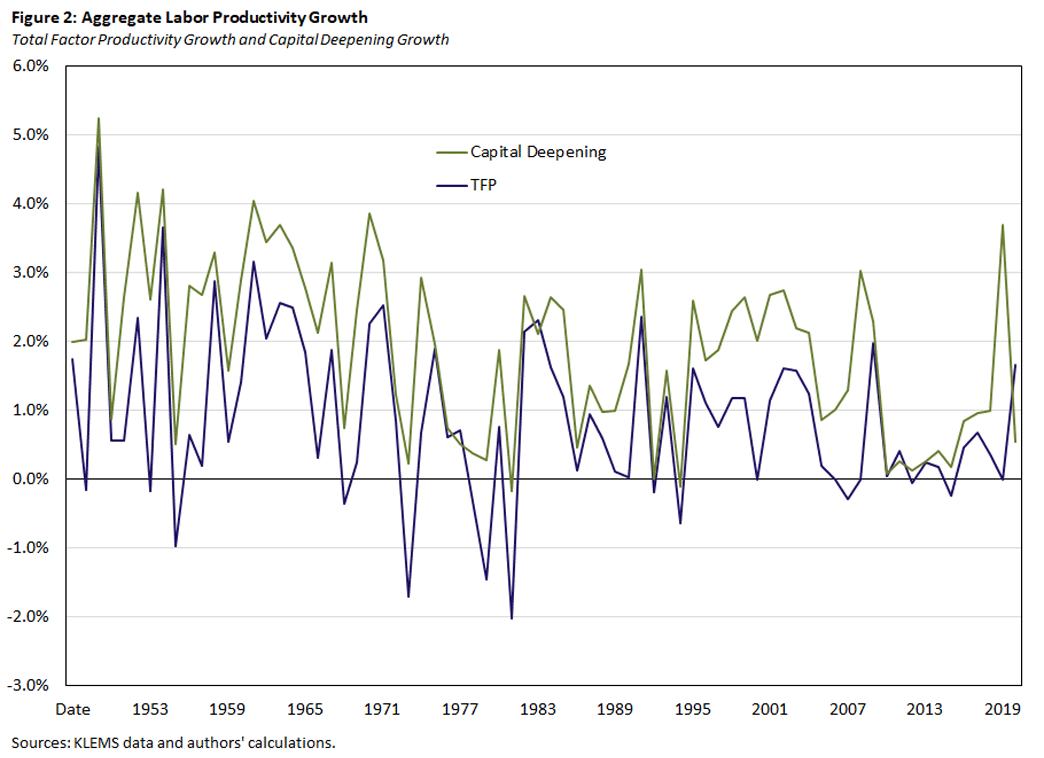
TFP grew at an average rate of 1.11 percent during the period 1947-1987 compared to 0.62 percent thereafter. Likewise, capital deepening slowed notably, growing at an average of 0.81 percent after 1987 compared to 1.16 percent in the prior period.
Because the U.S. economy is composed of different production sectors, aggregate productivity growth must ultimately reflect (a weighted average of) productivity growth in these different sectors. The question of which weights to use in aggregation was settled by Charles Hulten in 1978, who showed that the appropriate way to measure the productivity growth contribution of a given sector to overall productivity growth was by way of its value-added share in GDP.3
We divide the economy into five sectors:
- Construction
- Durable goods
- Intellectual property products (IPP, which includes research and development, software, and professional business services)
- Nondurable goods
- Services
Each of these sectors play a unique role in the postwar structural change of the U.S. economy. The share of goods-producing sectors (construction, durable goods and nondurable goods) has steadily fallen, thus the share of service-producing sectors (IPP and services) has steadily increased. At the same time, the share of input-producing sectors (construction, durable goods and IPP) has stayed remarkably constant over the postwar period at about 25 percent of GDP, thus the share of final-goods-producing sectors (nondurable goods and services) has also stayed remarkably constant.
The Strange and Awful Path of Productivity in the U.S. Construction Sector
Figure 3 shows that labor productivity growth in the construction sector declined in the early part of the postwar period — reflecting in part a similar decline in TFP — and has stayed notably low ever since. Labor productivity growth was only 0.37 percent for the full 1947-2021 period and has been a remarkable -1.00 percent since 1990, which we consider to be the start of the IT revolution. TFP has averaged only 0.13 percent growth postwar and, strikingly, -1.36 percent since 1990. Capital deepening, by contrast, grew steadily at an average of 0.39 percent since 1990 and 0.24 percent over the entire postwar period. These results are somewhat of an open puzzle in the productivity literature.
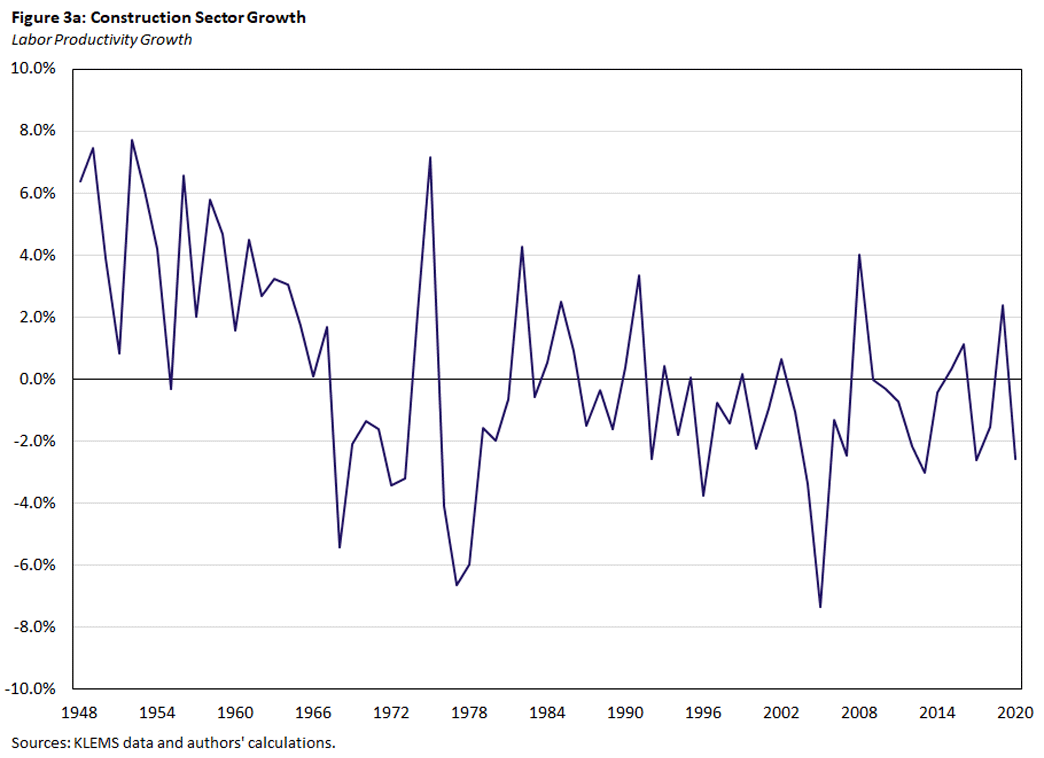
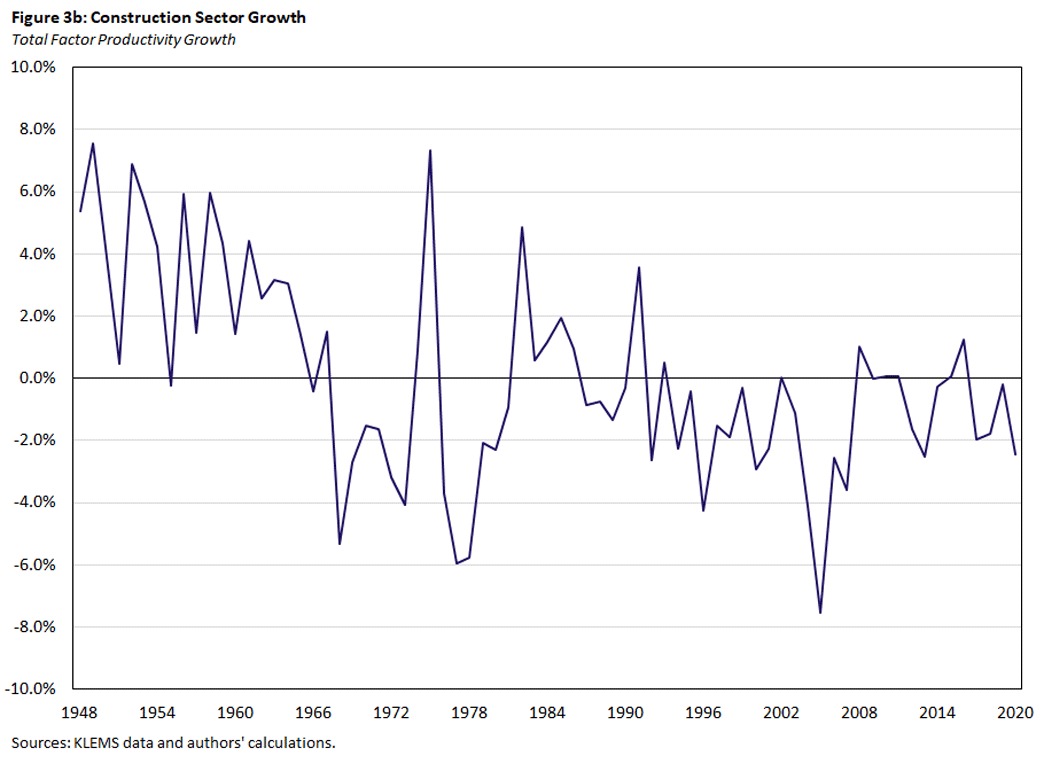
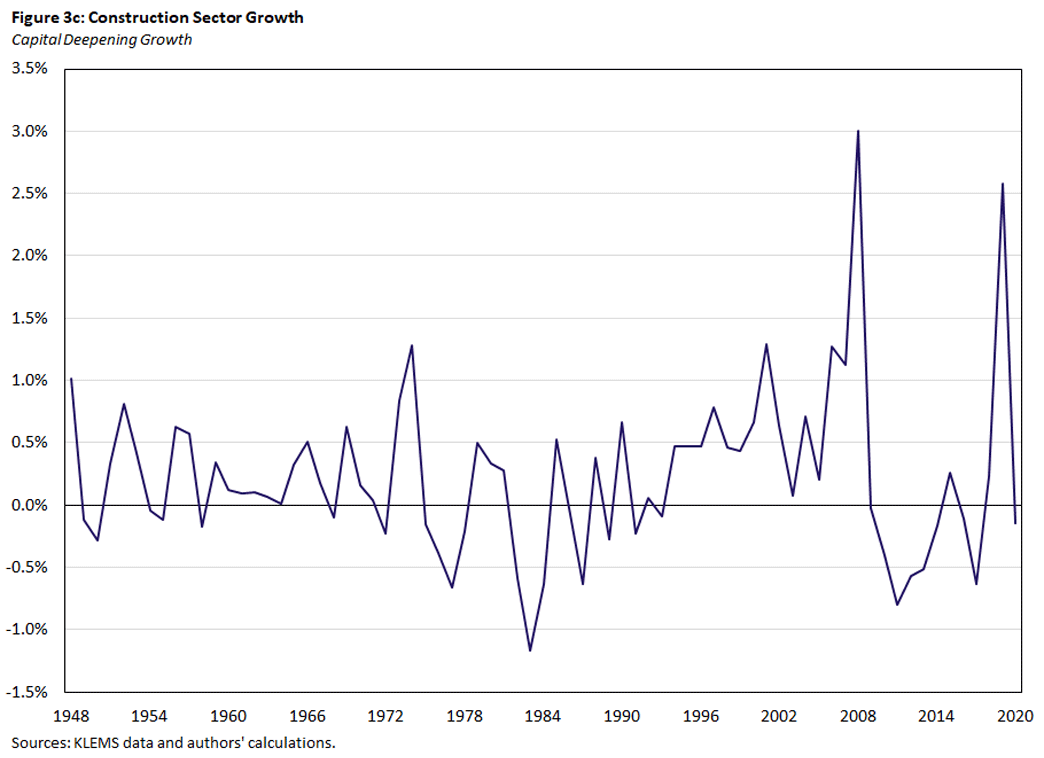
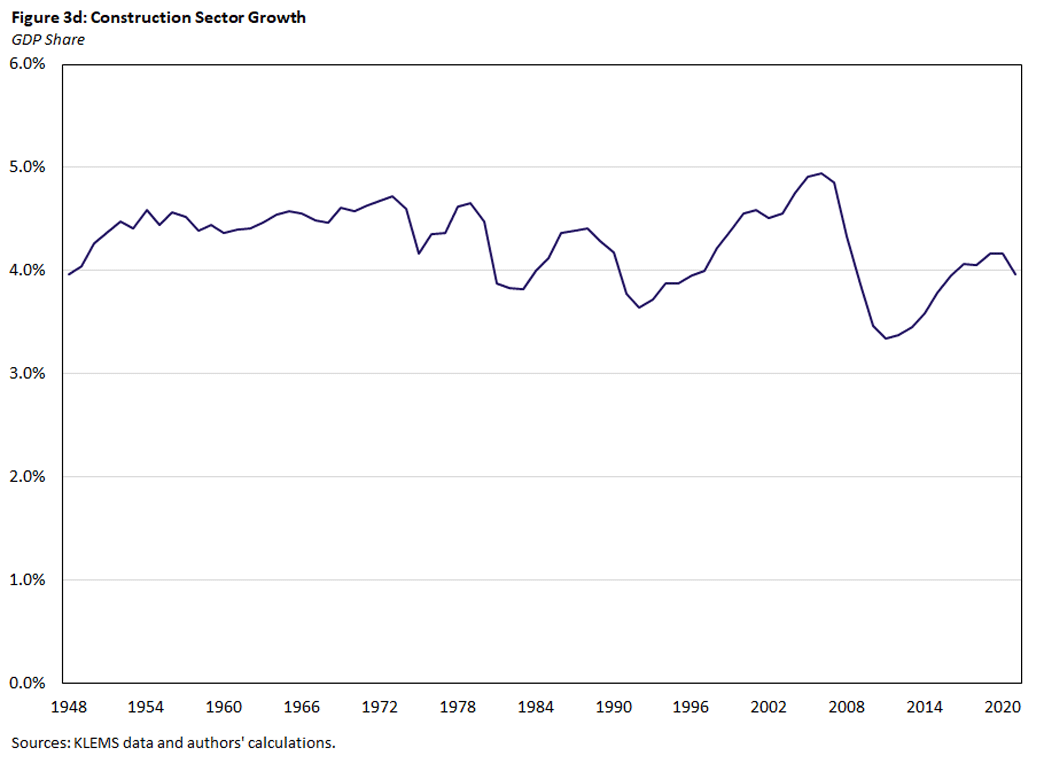
However, because the value-added share of construction in GDP has stayed relatively constant and small throughout the postwar period, the "strange and awful path of productivity" in that sector explored by Austan Goolsbee and Chad Syverson has had limited impact on overall productivity growth.4 They show that low productivity growth in construction is not solely attributable to measurement error. They further document how a noticeable decline in the efficiency with which inputs are transformed into output has contributed to low productivity growth in that sector. Moreover, they observe that regions with more productive construction sectors historically have failed to see growth in their share of U.S. construction activity, pointing to potentially important market frictions in that sector.
The Curse of Durable Goods?
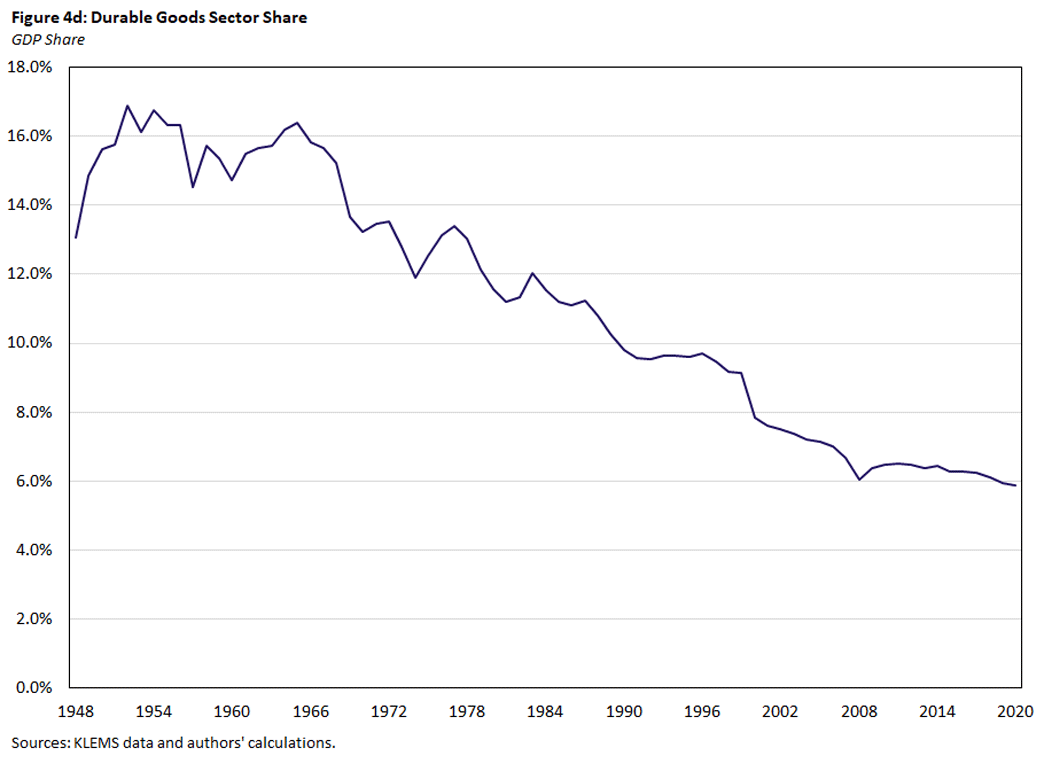
The durable goods sector was once the main supplier of inputs to U.S. production. However, as seen in Figure 4, the sector has steadily declined in that role from a peak share of GDP of 17 percent in 1953 to just 6 percent in 2021, or slightly more than the construction sector. The steady and pronounced fall in the GDP share of this otherwise productive sector is a key factor underlying the decline in aggregate labor productivity growth.
The declining share of the durable goods sector can be traced to two developments over the postwar period. First, IPP has steadily replaced durable goods as the dominant source of inputs in U.S. production in the form of software, professional services, and research and development. Second, the U.S. became a net exporter (rather than importer) of durable goods over time.
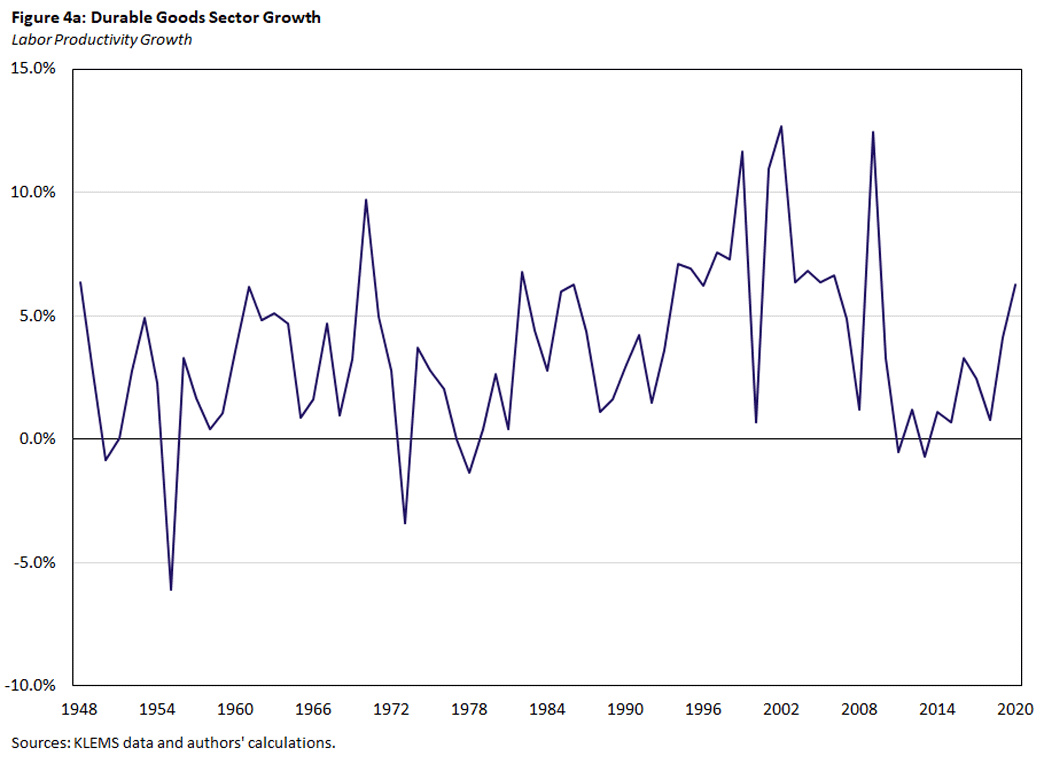
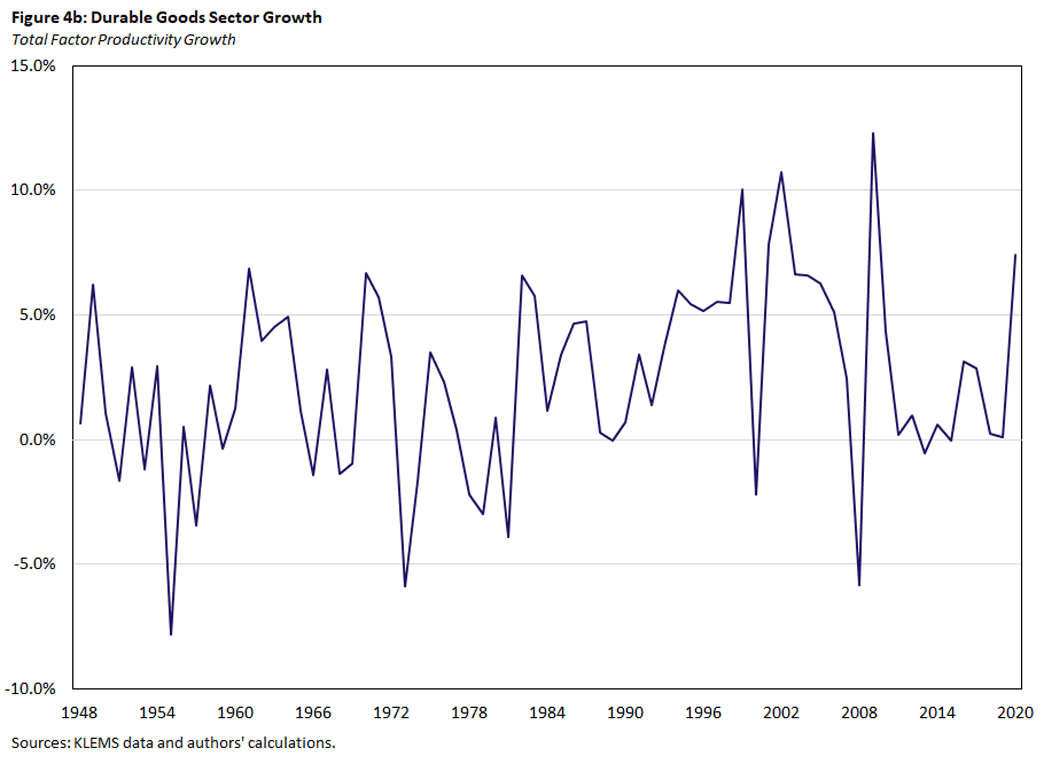
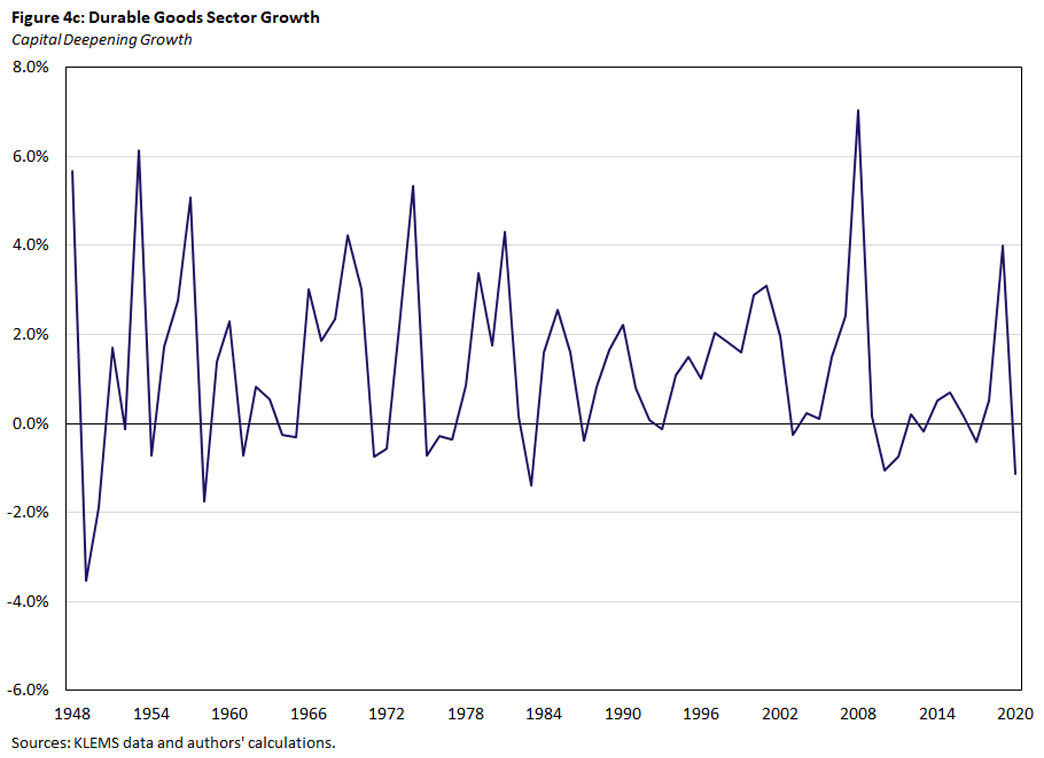
That said, the durable goods sector has been remarkably productive historically, experiencing productivity growth that exceeds that of all other sectors. This sector has experienced average labor productivity growth of 3.58 percent in the postwar period and 4.90 percent since 1990. These observations are also reflected in the TFP growth of that sector, which increased by an average of 3.75 percent annually since the IT revolution compared to just 2.36 percent annually in the entire postwar period.
The Promise of IPP
The IPP sector has gradually displaced durable goods as the dominant source of inputs in U.S. production. This largely explains why its share of GDP has grown from 4 percent in 1947 to 13 percent in 2021. This is a promising sign for aggregate productivity growth, as the IPP sector has been characterized by the most robust growth in labor productivity among all sectors considered here since 2016.
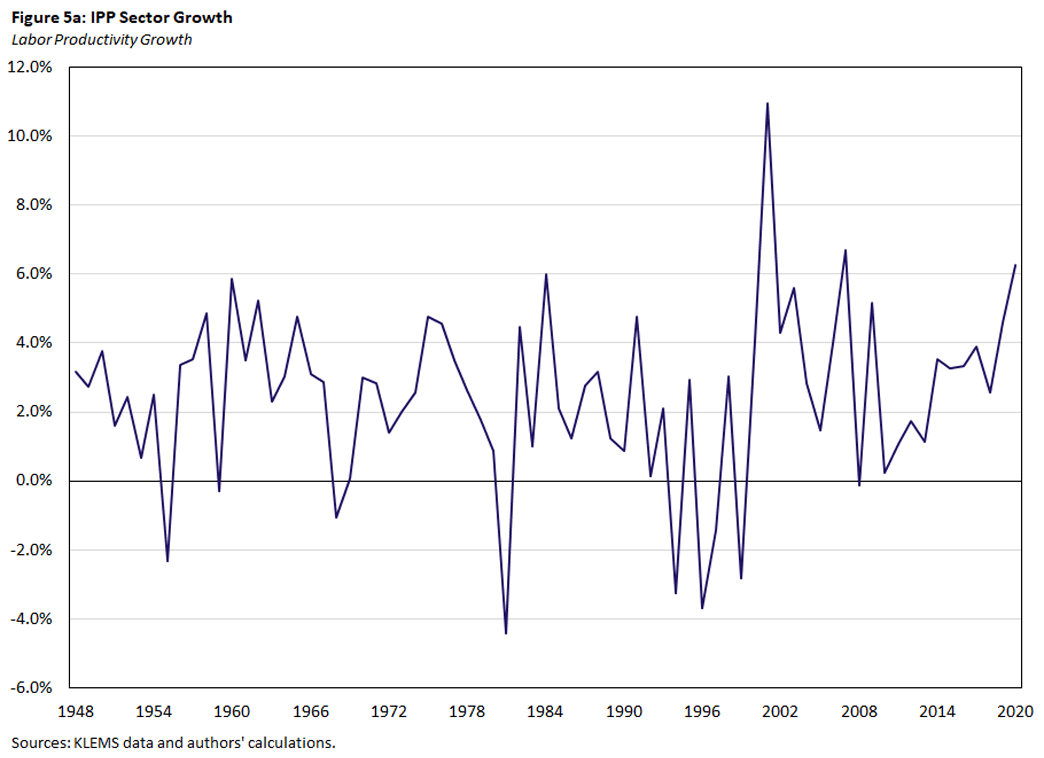
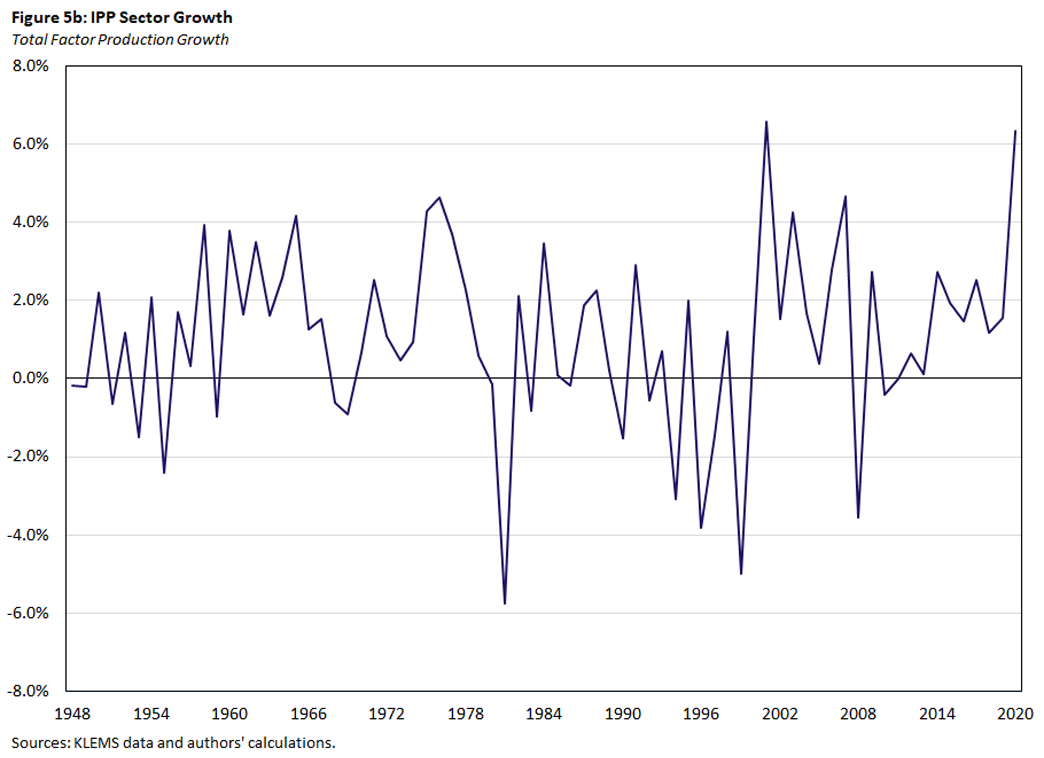
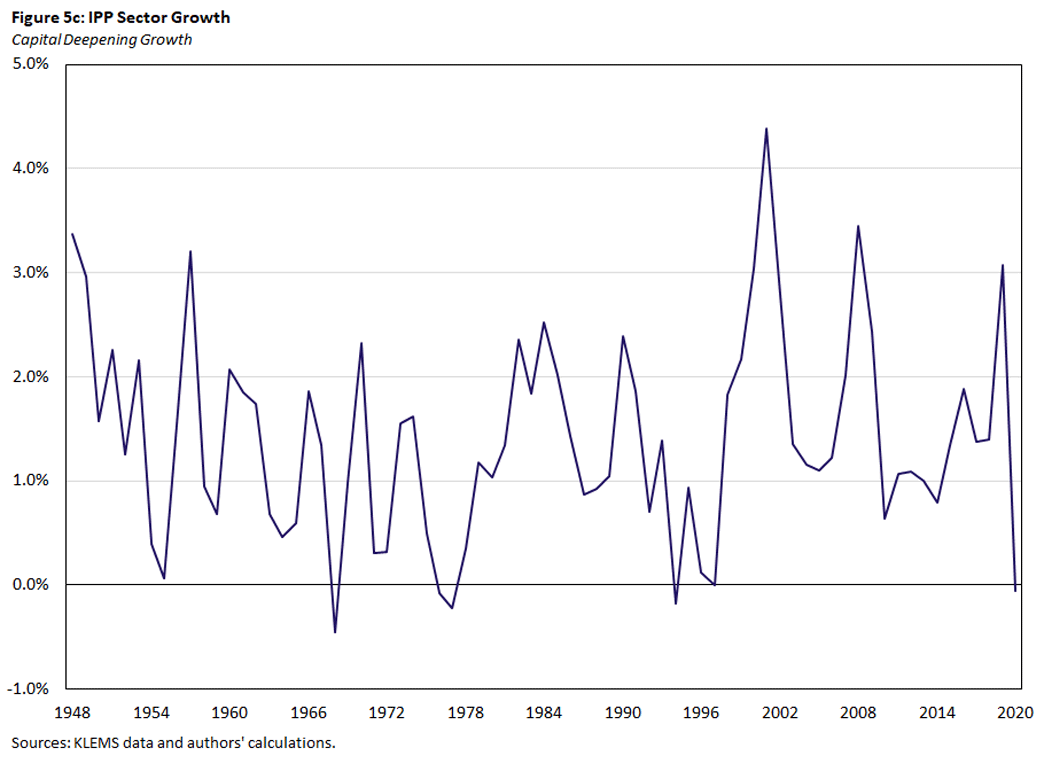
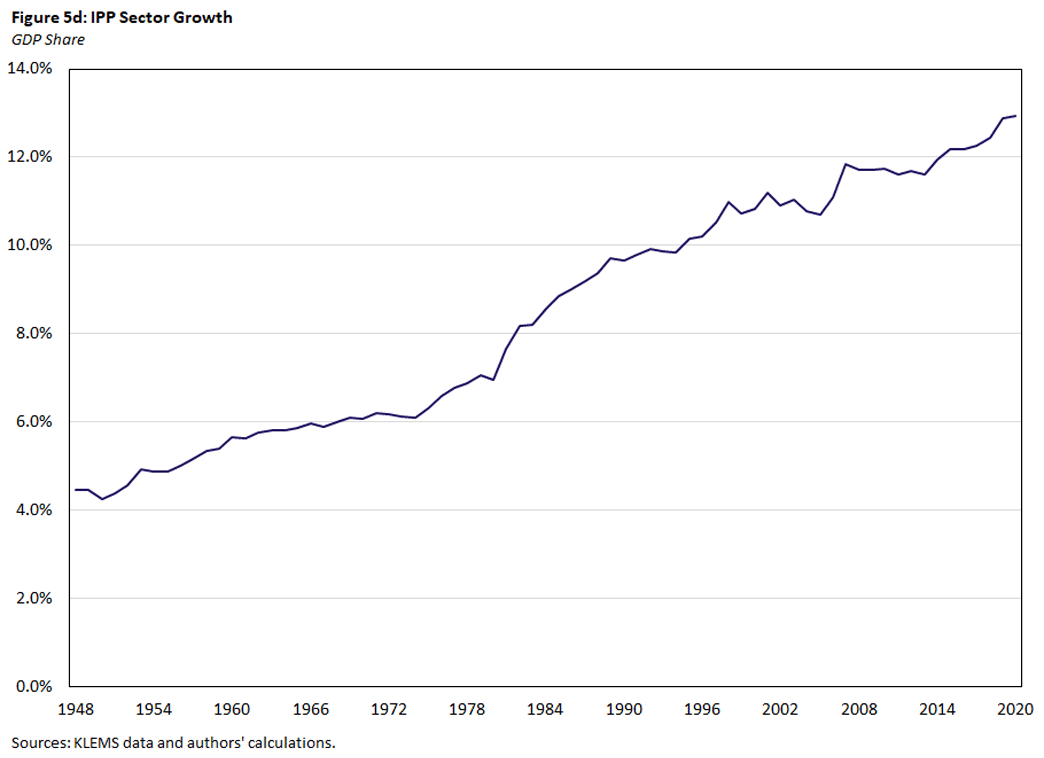
Figure 5 shows that labor productivity in the IPP sector has grown at an average rate of 2.40 percent since 1947, reflecting in equal part robust TFP growth and capital deepening. TFP grew at an average rate of 1.01 percent in the postwar period but, somewhat predictably, grew at a larger 1.02 percent since 1990. Capital deepening in the IPP sector grew at a robust 1.39 percent average in the postwar period but at an average of 1.54 percent since 1990, the highest average growth rate for capital deepening across all of the sectors.
The current emergence and adoption of artificial intelligence (AI) is poised to have the most direct and pronounced impact in the sectors encompassed by IPP.5
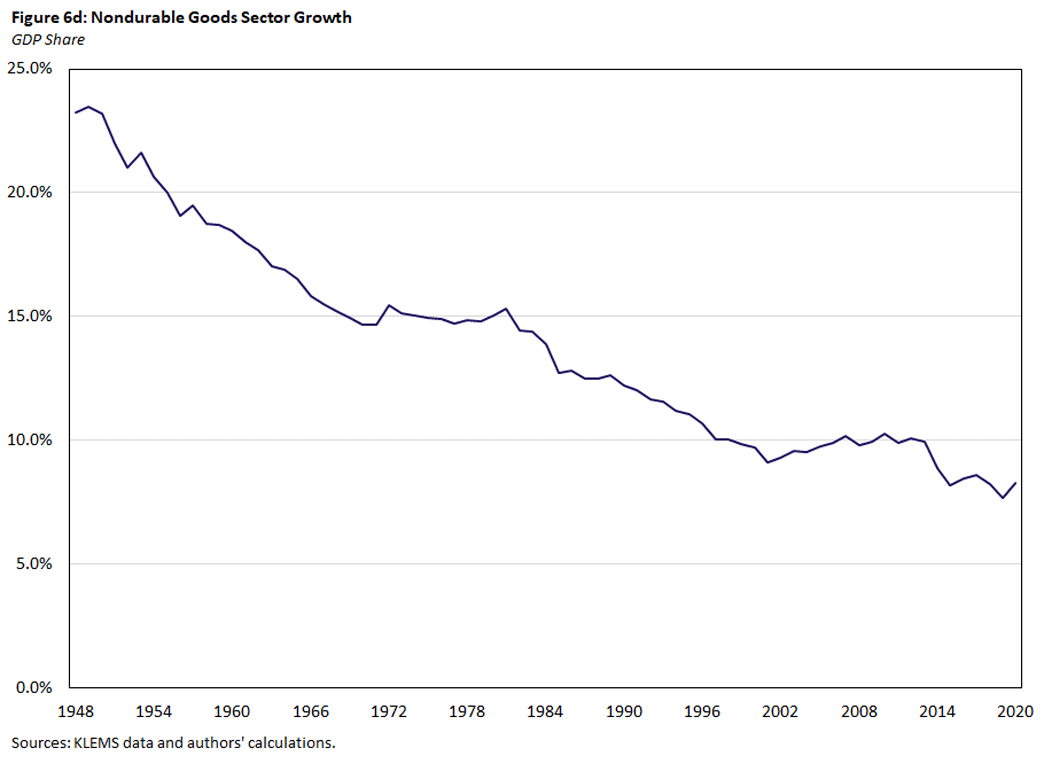
Nondurable Goods, or the Unexpected Virtue of Replacement
Historically the dominant supplier of goods for final consumption, the nondurable goods sector has largely been displaced by services. Figure 6d shows that this structural change has resulted in nondurable goods' share of GDP to plummet from a high of 24 percent in 1947 to 8 percent in 2021. Across the entire postwar period, the sector has averaged 14 percent of GDP.
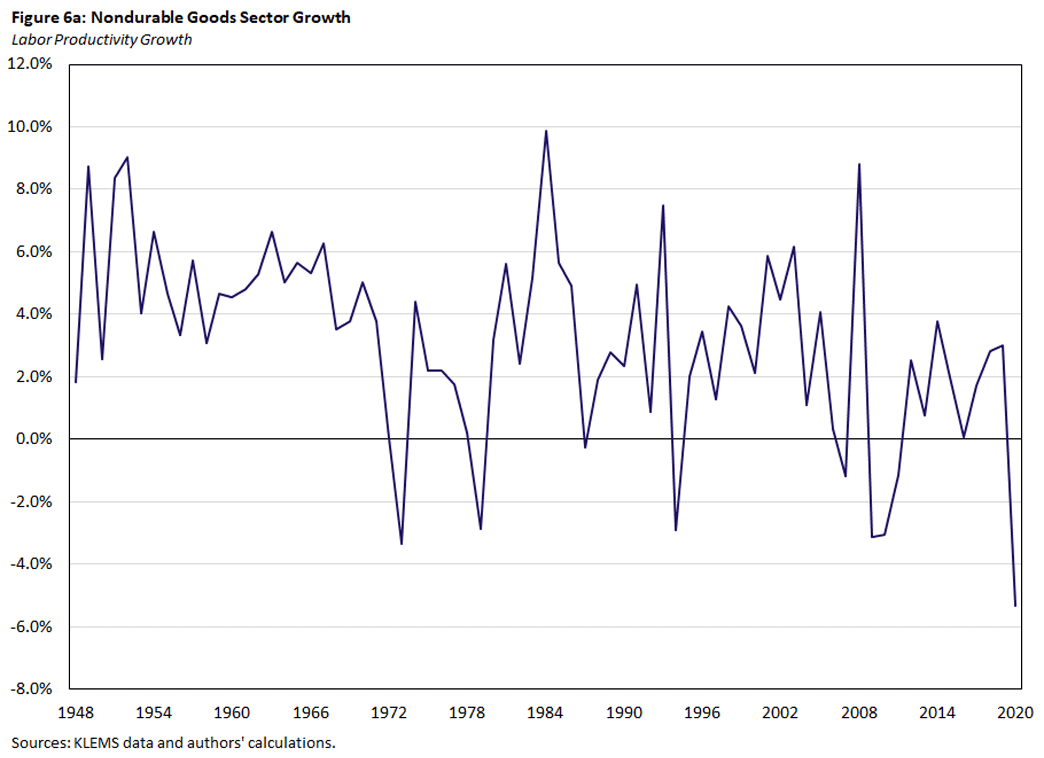
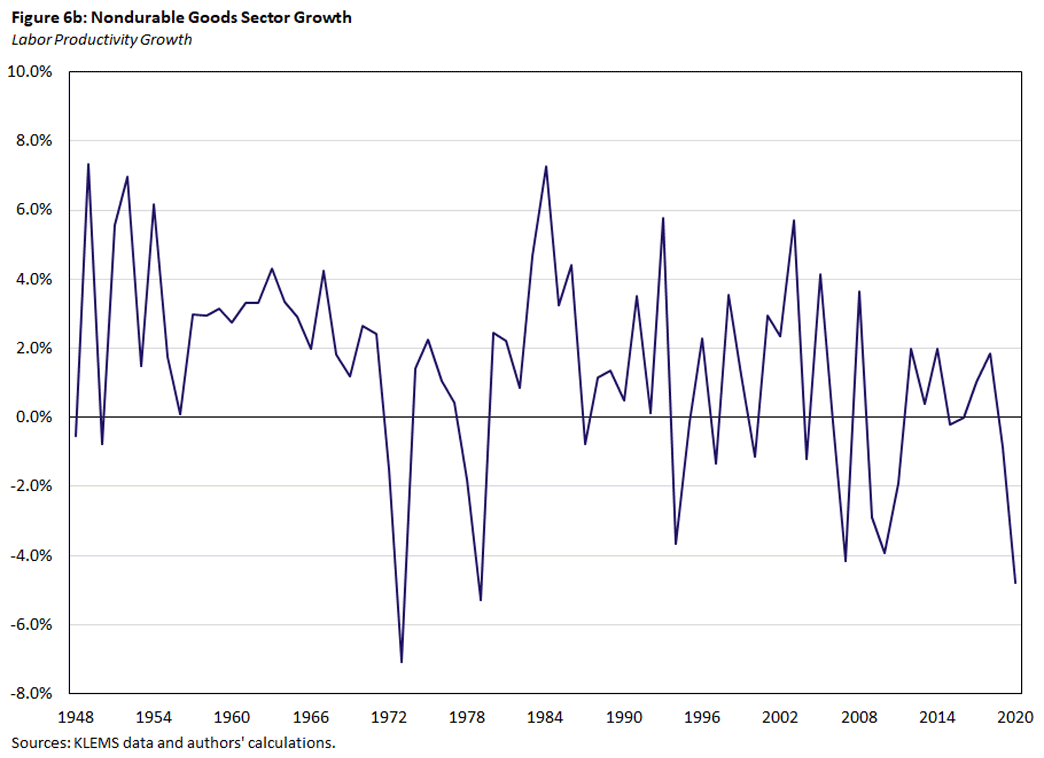
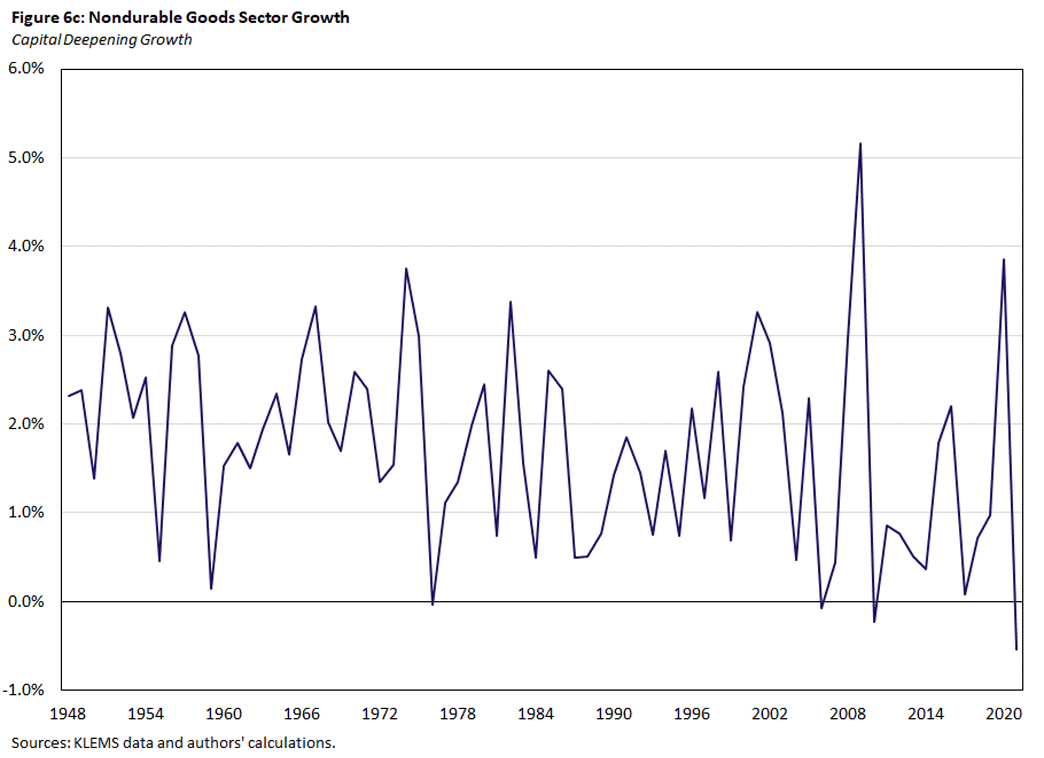
Growing at an average of 3.27 percent since the late 1940s, this sector has grown on average only 2.03 percent since 1990. This is reflective of similar trends in both sectoral TFP and capital deepening. Both component series have grown at worse rates since the IT revolution: TFP grew at an average of only 0.54 percent since 1990, compared to an average of 2.23 percent beforehand. Likewise, capital deepening went from growing at an average rate of 1.92 percent before 1990 to an average rate of 1.49 percent after 1990.
While the nondurable goods sector is becoming more unproductive, it is simultaneously contributing less to aggregate productivity growth owing to its falling share in GDP. However, its declining share is being subsumed by the most unproductive sector in this article: the service sector.
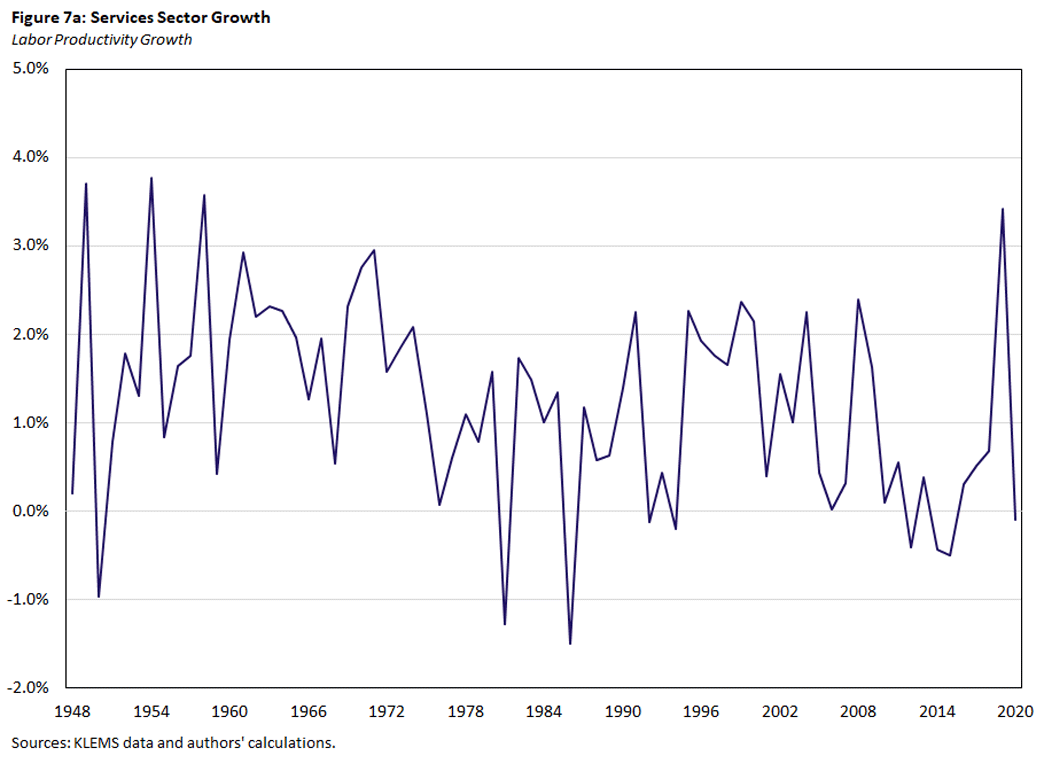
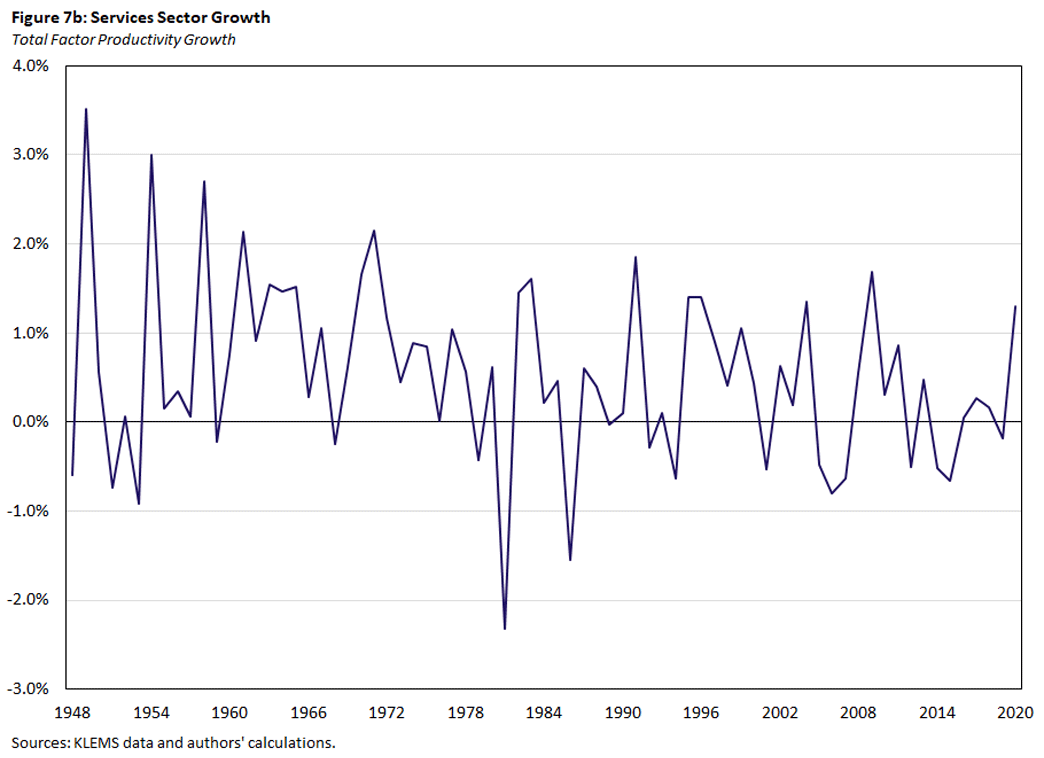
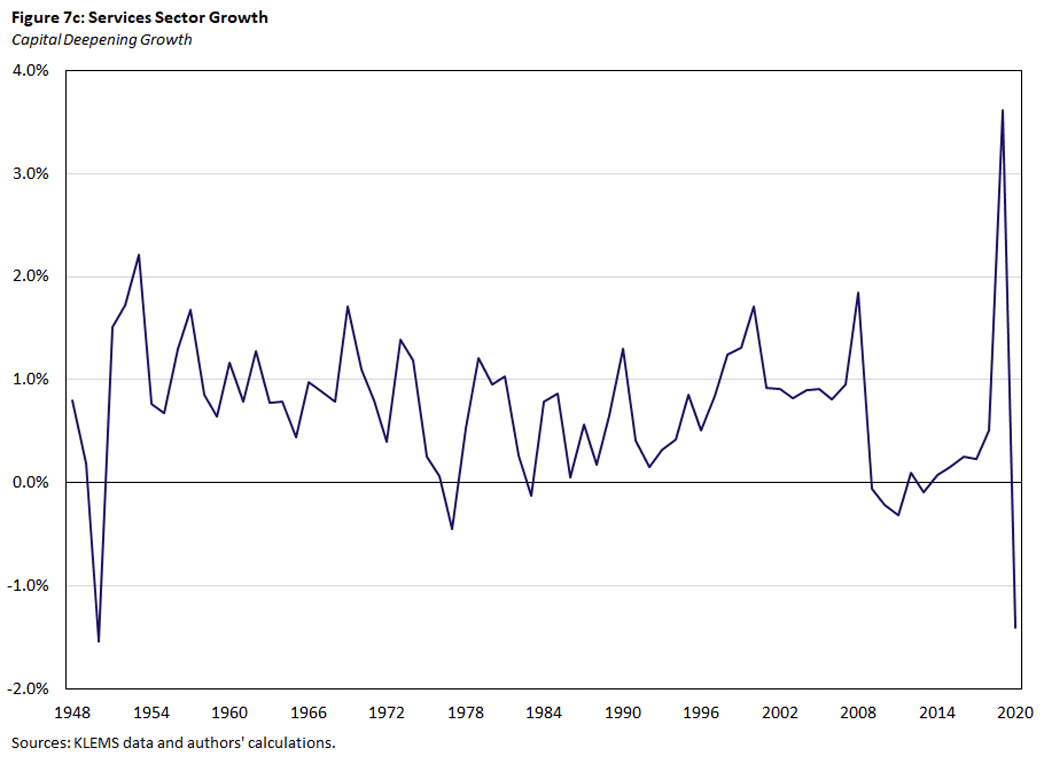
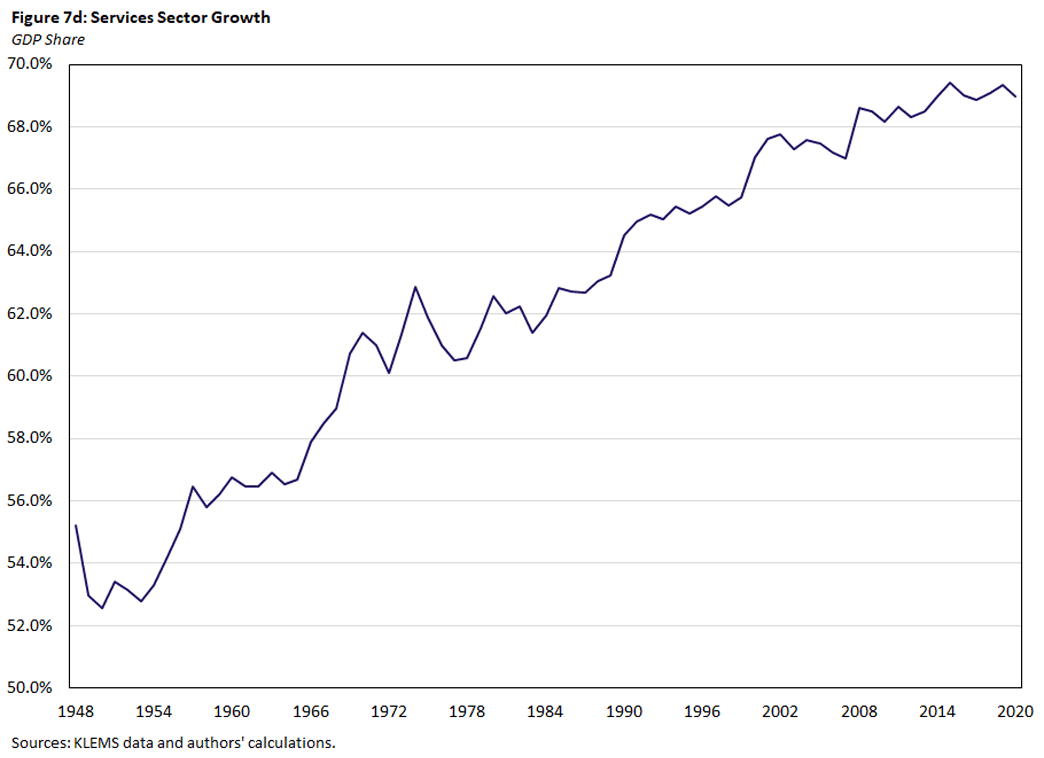
Services: Baumol's Cost Disease
The services sector — which has grown from 53 percent to 69 percent of GDP — is another key component underlying the middling performance of aggregate labor productivity and exemplifies the phenomenon known as Baumol's Cost Disease. This is the notion that a sector with low productivity but an increasing share in production will bring down productivity in the aggregate.
Growing at an average of 1.19 percent in the postwar period, service sector labor productivity has grown at an average of 0.98 percent since 1990. This (perhaps uninspiring) performance is also reflected in TFP growth: an average of 0.50 percent in the postwar period and only 0.33 percent since 1990. Capital deepening has experienced a similar drop in average growth, growing at an average of 0.72 percent before 1990 and 0.65 percent after.
The disappointing productivity growth in the services sector can be accounted for primarily by three subsectors:
- Management of companies
- Legal services
- Real estate
These three subsectors combined account for, on average, 14 percent of U.S. GDP in the postwar period. Management of companies and legal services exhibit flat productivity growth, roughly unchanged from 1947 to 2021. Real estate — which accounts for 11 percent of GDP by itself — has seen persistently declining productivity growth, with this decline accelerating after the Great Recession and never rebounding.
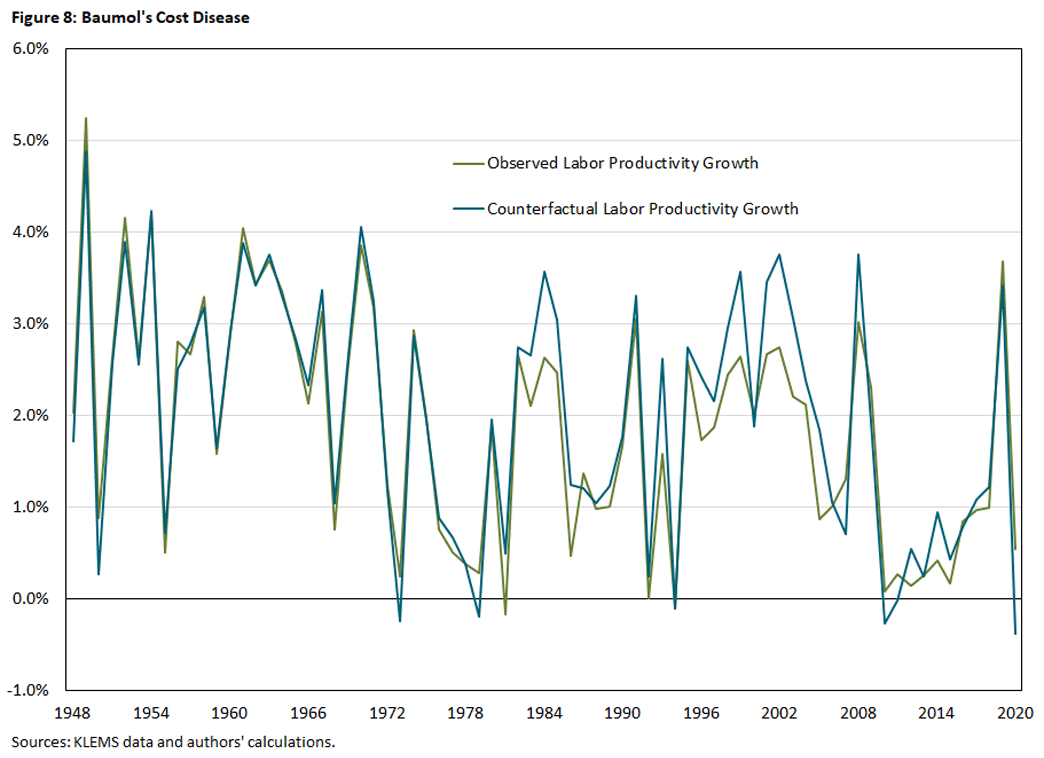
The Impact of Structural Change
Postwar structural change has seen the services sector take over much of the share in GDP from nondurable goods, and IPP has likewise taken over GDP share from durable goods. But to what extent has low aggregate productivity been the reflection of these structural shifts?
Figure 8 demonstrates what aggregate productivity growth would look like had the composition of the U.S. economy remained unchanged from 1947. On average, aggregate labor productivity would have grown at an average of 1.72 percent, compared to the observed 1.48 percent. This is largely due to lesser drag from a lower services sector share (where productivity growth has proved lackluster) and a substantial boost from a high durable goods share (where productivity growth has generally been strong).
Concluding Remarks: An IT Revolution Redux
Productivity growth in the IPP sector was approximately 6 percent in 2021. If AI contributes even an additional 2 percentage points to annual IPP productivity growth over the next five years, this would manifest as an increase of 0.3 percentage points in aggregate productivity annually over that period. However, as illustrated above, labor productivity in the IPP sector picked up starting in 2015, implying that there may be broader forces at play than AI contributing to an upward-moving trend in IPP productivity growth.
Our previous article notes that optimistic forecasts of aggregate productivity growth resulting from the adoption of AI range from 1.5 percent to 4 percent annually over the next decade. Given IPP's current GDP share of about 15 percent, productivity in the IPP sector — where AI adoption is most concentrated — would need to increase by 10 percent to 27 percent annually over the next decade to reach 1.5 percent to 4 percent annual growth in aggregate productivity. IPP sector productivity growth has been above 8 percent only once (2001-2002) in 74 years, thus making this scenario unlikely.
It may be that AI eventually bleeds into other sectors such as retail services, but a 2024 paper calculates that at most 5 percent of tasks across all sectors will be meaningfully impacted by AI over the next decade.6 It concludes that aggregate labor productivity will grow at most by an extra 0.07 percent annually, an estimate consistent with the observations in this article.
Pierre-Daniel Sarte is a senior advisor and Jack Taylor is a research associate, both in the Research Department at the Federal Reserve Bank of Richmond.
See the 2024 working paper "The Strange and Awful Path of Productivity in the U.S. Construction Sector" by Austan Goolsbee and Chad Syverson.
See our 2024 article "The Productivity Puzzle: AI, Technology Adoption and the Workforce," co-authored with Erin Henry.
See Hulten's 1978 paper "Growth Accounting With Intermediate Inputs."
See their previously cited paper "The Strange and Awful Path of Productivity in the U.S. Construction Sector."
See the 2025 article "Quarterly Industry-Level Labor Productivity Data for the U.S." by Bart Hobijn, Marti Mestieri, Nicolas Werquin and Jing Zhang.
See the 2024 paper "The Simple Macroeconomics of AI" by Daron Acemoglu.
To cite this Economic Brief, please use the following format: Sarte, Pierre-Daniel; and Taylor, Jack. (February 2025) "Sectoral Determinants of Aggregate Productivity Growth." Federal Reserve Bank of Richmond Economic Brief, No. 25-08.
This article may be photocopied or reprinted in its entirety. Please credit the authors, source, and the Federal Reserve Bank of Richmond and include the italicized statement below.
Views expressed in this article are those of the authors and not necessarily those of the Federal Reserve Bank of Richmond or the Federal Reserve System.
Receive a notification when Economic Brief is posted online.