Stay Ahead
Explore the latest results from the SOS Recession Indicator, updated weekly.
Explore the latest results from the SOS Recession Indicator, updated weekly.
For consumers of economic data navigating an overgrown jungle of economic facts, figures and statistics, leveraging simple statistical regularities can be useful in tracking important changes in the momentum of the economy. For example, many economic analysts interpret two consecutive quarterly declines in gross domestic product (GDP) as an indicator of recession, even though the National Bureau of Economic Research (NBER) uses several other indicators to determine official recession start and end dates. Another very popular recession indicator is the Sahm rule, which signals the start of a recession when the three-month moving average of the unemployment rate rises by at least 0.5 percentage points relative to its minimum over the previous 12 months.
Such rules of thumb attempt to balance accuracy, timeliness and ease of understanding to varying degrees of success. Relying on GDP readings or NBER announcements require long waits (usually until after the recession is over), which is why economists have relied on more timely indicators based on surveys,1 bond market data2 or the unemployment rate3.
However, increased timeliness can also come at the cost of accuracy. For example, a 2024 paper finds that the Sahm rule has a mixed performance record as an early indicator for recessions, and that it tends to only become a useful indicator four months after a recession has started.4 Additionally, a separate 2024 article identifies at least four instances when the Sahm rule triggered false alarms since 1950, that is, when unemployment rose more than 0.5 percentage points without a subsequent recession.5
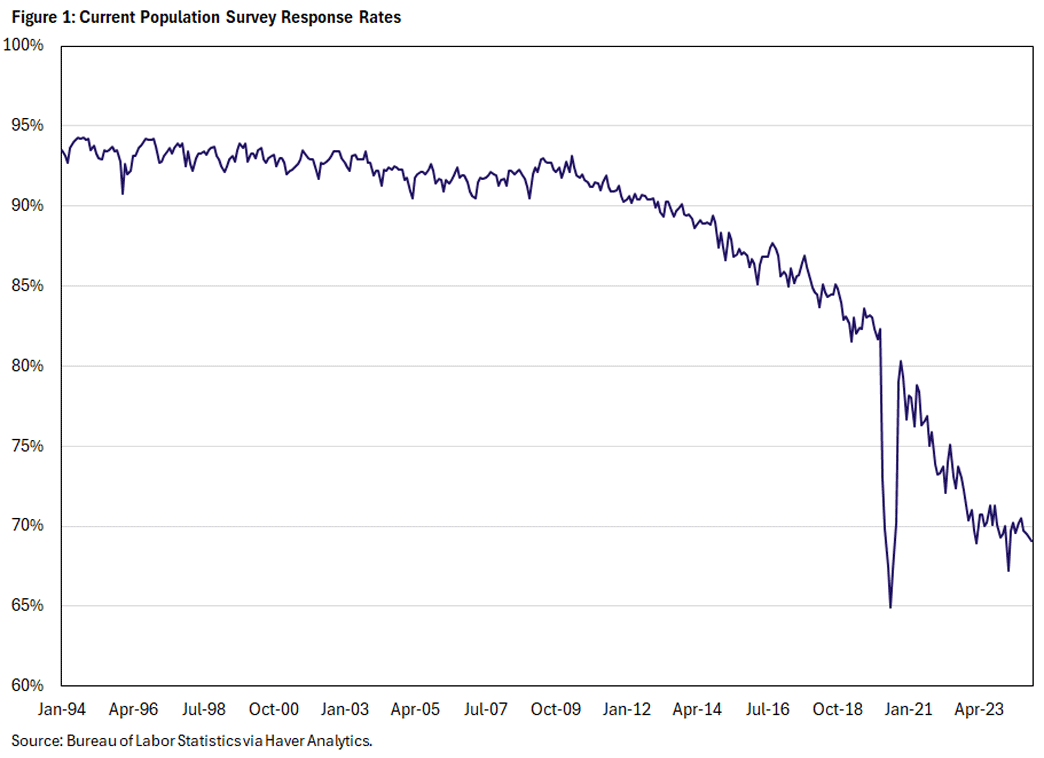
In addition to these challenges, data quality concerns can pose a challenge for rules of thumb based on household survey data. The unemployment rate is based on underlying data from the Current Population Survey (CPS), a survey of about 60,000 households. In recent years, response rates to the CPS have been declining, as seen in Figure 1. According to the BLS, if these trends continue, they could induce nonresponse bias into CPS-based data such as the unemployment rate.6 At a more granular level, such nonresponse bias could disproportionately and systematically affect certain segments of the CPS sample: A 2023 paper shows that the addition of citizenship questions into the CPS has resulted in a higher rate of nonresponse in states with higher rates of noncitizen and Hispanic populations.7
Even when households do respond to the CPS, there are other sources of sampling variability inherent in measuring the unemployment rate,8 which could lead to inaccurate inferences. For example, during the COVID-19 pandemic, the BLS noted that the unemployment rate was affected by a misclassification due to laid-off workers reporting they were employed but absent from their jobs.9 In 2024, an apparent triggering of the Sahm Rule — despite strength in many other labor market indicators — could have been related to a surge of immigration pushing up the unemployment rate, rather than an actual weakening of labor market demand.10
In our recent paper "A Better Sahm Rule? Introducing the SOS Recession Indicator," we propose a new indicator that shares the simplicity of the Sahm rule while also offering increased timeliness and accuracy in signaling a recession.11 The indicator — which we call the Scavette-O'Trakoun-Sahm-style (SOS) recession indicator — is derived from the insured unemployment rate. This rate measures the percentage of individuals covered by unemployment insurance who are actively receiving unemployment benefits. Data are compiled by the Department of Labor from states and territories administering unemployment insurance programs. The SOS indicator signals a recession when the 26-week moving average of the insured unemployment rate rises more than 0.2 percentage points relative to its minimum over the 52 preceding weeks.
Because the indicator is based on filings for unemployment insurance rather than household surveys, it avoids data challenges related to households' willingness and ability to accurately respond to surveys and correctly understand survey questions. In addition, because data on unemployment insurance claims are available weekly, the SOS can provide a timelier indicator of recession risk than other rules of thumb based on monthly data.
Figure 2 plots the Sahm and SOS series from 1971 through 2024, along with their respective thresholds of 0.5 and 0.2 percentage points. NBER recession months are indicated by gray-shaded vertical bars.
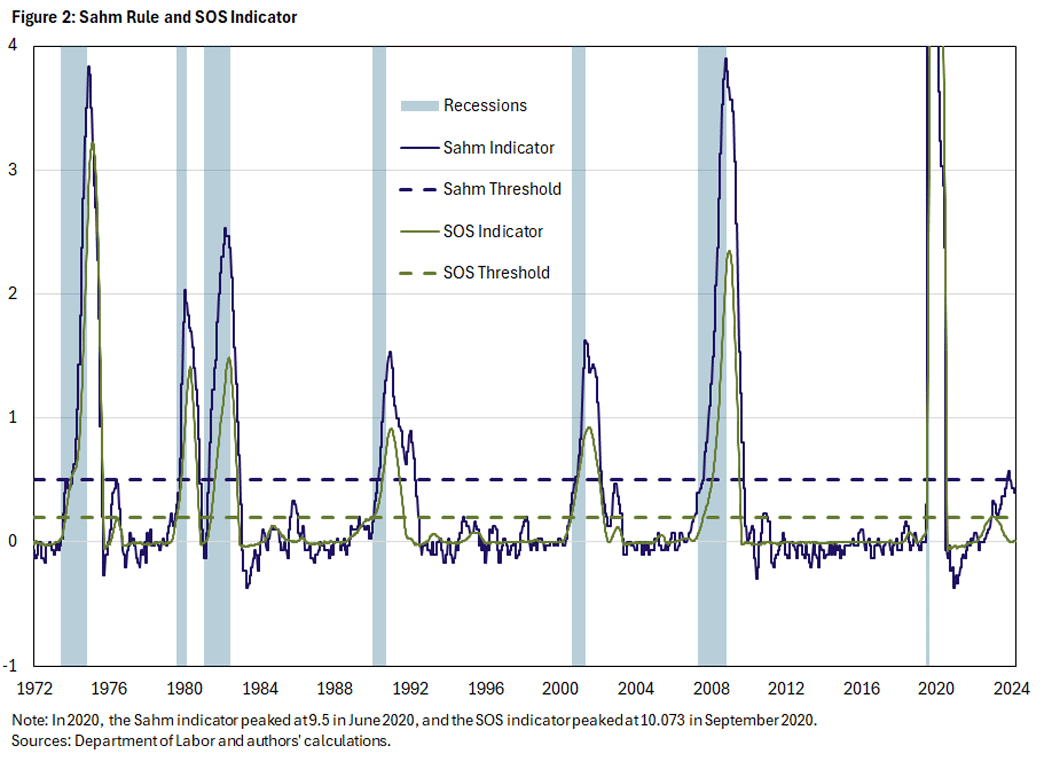
We find that both series correctly indicated the past seven recessions. However, the Sahm indicator had two false positives in 2003 and 2024, when the series reached or exceeded its threshold outside of a recessionary period.12 On the other hand, SOS did not produce any false positives in our sample period from 1971 through 2024, despite coming close to the threshold in 2023.
Also, our rule has on average identified recessions earlier than the Sahm rule. Table 1 indicates the month each of the seven recessions in our sample began (according to the NBER), along with the months when the Sahm and SOS series crossed their respective thresholds to signal the recession.
| Recession Month | Sahm Rule > 0.5 | Time Since Recession Start | SOS Indicator > 0.2 | Time Since Recession Start |
|---|---|---|---|---|
| November 1973 | July 1974 | 8 months | February 1974 | 3 months |
| January 1980 | February 1980 | 1 month | February 1980 | 1 month |
| July 1981 | November 1981 | 4 months | December 1981 | 5 months |
| July 1990 | October 1990 | 3 months | September 1990 | 2 months |
| March 2001 | July 2001 | 4 months | March 2001 | 0 months |
| December 2007 | February 2008 | 2 months | April 2008 | 4 months |
| February 2020 | April 2020 | 2 months | March 2020 | 1 month |
| Sources: Department of Labor and authors' calculations. | ||||
On average, the Sahm rule signaled a recession 3.4 months after the official start month, while SOS was 2.3 months behind. There are only two instances when Sahm indicated a recession before SOS:
While the average difference in recession timing across the seven recessions is only one month between the two series, there are two instances when the SOS indicator signaled a recession several months before the Sahm rule:
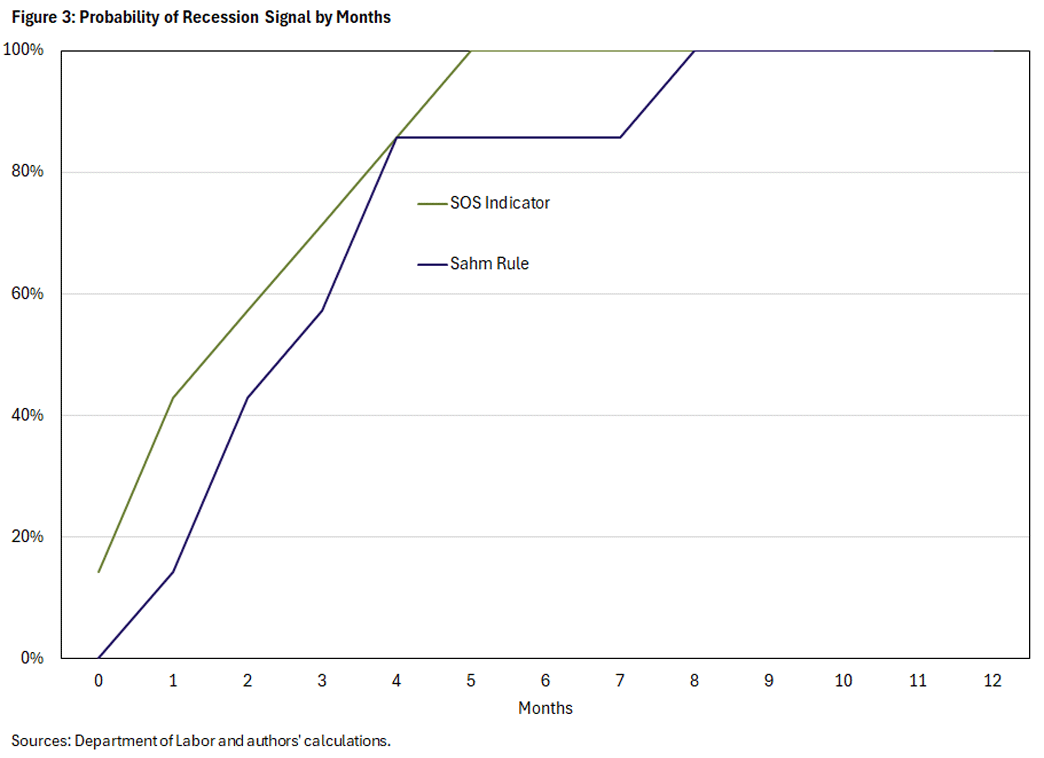
Figure 3 shows the probability of a recession having been signaled by the Sahm rule and SOS indicator by months since the NBER start date. Overall, the Sahm rule signals a recession with 100 percent probability roughly eight months after a recession has officially started. However, the SOS indicator signals a recession with 100 percent probability five months after its official start date.
These results suggest that the SOS indicator shares advantages with the Sahm rule (such as simplicity and accuracy in signaling the past seven recessions) and has a number of additional benefits. First, we show the SOS indicator has historically produced no false positives over the sample period, and it has on average signaled recessions sooner relative to their official NBER-determined start dates. Additionally, the SOS indicator is available on a weekly basis, and it relies on administrative data. This allows it to be more timely and less sensitive to sampling bias than the Sahm rule, as well as competing alternatives (such as the rule recently discussed by Pascal Michaillat and Emmanuel Saez13), which also leverage monthly survey-based data.
These improvements could make the SOS indicator a better prompt for activating automatic stabilizers (such as stimulus payments) than the Sahm rule, which was the latter's intended purpose when introduced in 2019. While past performance is no guarantee of future success, the SOS indicator can offer a simple and timely framework for economists, analysts and economic journalists to track deteriorations in U.S. labor market in the wake of business cycle downturns.
John O'Trakoun is a senior policy economist in the Research Department at the Federal Reserve Bank of Richmond. Adam Scavette is a community development economic advisor at the Federal Reserve Bank of Philadelphia.
For example, see my (Adam's) 2014 report "Are We in a Recession? The 'Anxious Index Nowcast' Knows!"
For example, see the 2022 article "Recession Predictors: An Evaluation" by Andreas Hornstein.
For example, see the 2019 article "Direct Stimulus Payments to Individuals" by Claudia Sahm or the 2023 article "Unemployment Changes as Recession Indicators" by Andreas Hornstein.
See the 2024 paper "Works Like a Sahm: Recession Indicators and the Sahm Rule" by Thomas Ash and Jerry Nickelsburg.
See the 2024 article "Rising Unemployment Does Not Mean Recession Is Inevitable" by Tyler Atkinson.
See the BLS's website for more information on CPS response rates.
See the 2023 paper "Does Asking About Citizenship Increase Labor Survey Nonresponse?" by Robert Bernhardt and Phanindra Wunnava.
See the 2024 report "The Signal and Noise in UI Claims" by the Council of Economic Advisers.
See the 2020 blog post "Update on the Misclassification That Affected the Unemployment Rate" from the BLS.
See the 2024 article "Why This Economic Cycle Is Defying History — and Breaking the Rules" by Joe Seydl.
This Economic Brief draws heavily from the language in our paper, forthcoming in Economics Letters.
Also, the previously cited paper "Rising Unemployment Does Not Mean Recession Is Inevitable" finds that the Sahm rule had false positives using real-time data in 1959 and 1967, outside the period examined.
See Michaillat and Saez's 2024 working paper "Has the Recession Started?" for details.
To cite this Economic Brief, please use the following format: O'Trakoun, John; and Scavette, Adam. (February 2025) "SOS! Signaling Recessions Earlier." Federal Reserve Bank of Richmond Economic Brief, No. 25-07.
This article may be photocopied or reprinted in its entirety. Please credit the authors, source, and the Federal Reserve Bank of Richmond and include the italicized statement below.
Views expressed in this article are those of the authors and not necessarily those of the Federal Reserve Bank of Richmond or the Federal Reserve System.
Receive a notification when Economic Brief is posted online.