Understanding Diffusion Indexes: Insights and Applications
Economic Brief
February 2025, No. 25-05
Key Takeaways
- Diffusion indexes (DIs) are commonly used to analyze economic trends. They offer timely insights into economic activity and are valuable for assessing employment trends, consumer sentiment and sectoral shifts.
- While DIs capture the prevalence of change ("how many"), they do not necessarily account for the intensity ("how much"). Misinterpreting their values can lead to inaccurate conclusions. Adding confidence intervals and polarization indicators improves their reliability.
- The relevance of DIs shifts in different economic contexts. For instance, during the pandemic-induced recession, the intensity of change outweighed the breadth, emphasizing the need to consider both "how many" and "how much" dynamics for a better understanding of economic shifts.
Diffusion indexes (DIs) are statistics that offer timely glimpses into the state of the economy.1 Frequently constructed from responses to qualitative surveys, these indexes provide a snapshot of the direction and breadth of change in key economic variables.
Typically, these surveys ask participants to report whether a specific variable — such as employment or business conditions — improved, declined or remained unchanged compared to a previous period. The responses are then aggregated to calculate a DI, often expressed as a percentage. A DI above a certain threshold — which varies depending on the weighting method — typically signifies an expansionary scenario, while a DI below the threshold indicates a contractionary one.
The appeal of DIs generally lies in their timeliness, simplicity and relatively low cost of participation. They offer insights into economic conditions more rapidly than traditional economic data releases, making them valuable tools for policymakers, analysts and market participants.
This article explores various uses and interpretations of DIs using data from three sources:2
- Sectoral employment growth from the Bureau of Labor Statistics (BLS)
- The Federal Reserve Bank of Richmond's manufacturing survey
- Consumer sentiment from the University of Michigan's Surveys of Consumers
Measuring the Breadth of Change
The actual change of an aggregate economic series can be broken down into "how much," or the intensity of the change, and "how many," or the breadth of the change. One of the strengths of DIs is their ability to measure the "how many" aspect of economic activity. A DI shows how many entities within a particular sector or economy are experiencing a change in a specific variable.
For instance, a DI for employment can reveal how many firms are increasing hiring, while a DI for consumer sentiment can indicate how many consumers are optimistic about the economy's future. This information is valuable for gauging the overall direction of economic activity, as it highlights the prevalence of specific trends across a wide range of participants and sectors.
Decomposing Employment Growth
The BLS publishes an employment DI, monitoring changes across roughly 260 sectors. These indexes help determine if employment shifts are widespread or concentrated in specific industries. To evaluate the "how much" and "how many" aspects, we decompose BLS employment growth and analyze the evolution of these components over time.
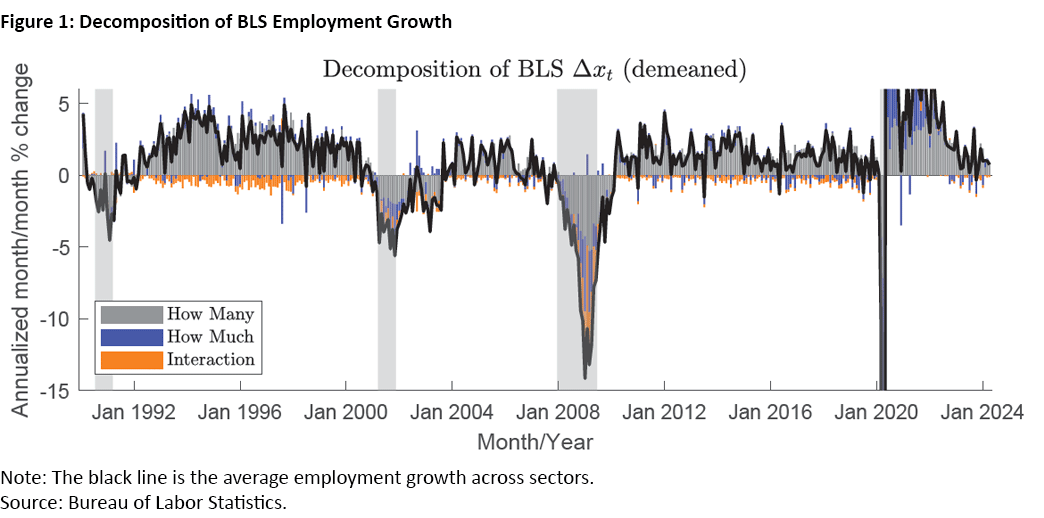
This analysis suggests that DIs could be reliable indicators of economic activity, especially when analyzing employment trends — in other words, changes in "how many" explain an important part of changes in aggregate employment growth — but there are some important caveats.
Prepandemic Trends
Until 2020, changes in the breadth of employment growth ("how many") as measured by DIs accounted for a substantial portion of the fluctuations in aggregate employment growth. This implies that, during periods of relative economic stability, employment growth is often driven more by the number of firms adding or losing jobs than by extreme changes in employment levels within individual sectors.
Recessions
During recessions, a distinct pattern emerges. The intensity of change ("how much") becomes more influential in shaping employment trends. In these downturns, both the "how much" and "how many" components (along with their interaction) play significant roles in driving the decline in employment. This suggests a potential asymmetry in how employment dynamics unfold during expansions and contractions.
Pandemic Effects
The pandemic further highlighted the importance of the intensity of change ("how much"). During the pandemic-induced recession, the "how many" margin (typically captured by DIs) played a relatively smaller role, while the "how much" margin became dominant, both during the steep decline and the subsequent recovery. This unusual pattern reflects the unique nature of the pandemic shock, which led to widespread and simultaneous job losses across numerous sectors and emphasized the intensity of the change rather than the breadth.
Usefulness and Limitations of DIs
These findings underscore the value of DIs in understanding employment dynamics. By providing insights into the "how many" component, DIs help to disentangle the underlying forces driving employment trends and reveal important asymmetries in how employment responds to different economic conditions.
Other applications of DIs indicate that they can serve as reliable indicators of economic activity in various settings. One example comes from my 2017 article "Using the Richmond Fed Manufacturing Survey to Gauge National and Regional Economic Conditions," co-authored with Nika Lazaryan. In that article, we evaluate the Richmond Fed's manufacturing survey of business conditions and assess the survey's ability to explain national and regional economic conditions. We find that the DIs reported by the survey perform reasonably well in explaining both national and regional economies. The analysis also suggests that the predictive power of these indexes can be improved by considering models with richer dynamic structures and by adjusting the weights used in the calculation of the composite DI.
Despite their usefulness, DIs come with limitations that need to be carefully considered. DIs are most effective when analyzing variables where the breadth of change ("how many") is the primary driver of aggregate changes. However, they might not be as informative when dealing with variables heavily influenced by the intensity of change ("how much").
A prime example is average wages. Wage movements often reflect the magnitude of wage adjustments within firms or sectors rather than the number of firms increasing or decreasing wages. A company might implement substantial pay raises for its entire workforce, leading to a significant shift in average wages even if the proportion of firms raising wages remains relatively stable. In such cases, a DI based on the number of firms adjusting wages would not accurately capture the true dynamics of wage changes.
Another crucial limitation is that DIs cannot be directly interpreted as measures of disagreement. A DI value of zero can arise from two very distinct scenarios, both leading to the same numerical outcome but reflecting different underlying economic realities.
- Scenario 1 (high polarization): Half of the survey respondents report an increase, and the other half report a decrease. This situation suggests a high degree of polarization or disagreement within the economy, as firms or sectors hold opposing views on the direction of change.
- Scenario 2 (uniform stagnation): All respondents report no change. This scenario implies greater consensus and stability, with firms or sectors experiencing similar conditions.
Misinterpreting a DI of zero as simply indicating no change without considering the underlying distribution of responses can lead to flawed conclusions about the state of the economy. While a DI might suggest stability at the aggregate level, a high degree of polarization beneath the surface could signal potential volatility or uncertainty. Recognizing this distinction is key for policymakers, analysts and anyone else using DIs to gauge economic conditions.
Enhancing DI Interpretation: Confidence Intervals and the Disagreement Indicator
The interpretation of DIs can be improved by reporting — along with the DI itself — the indexes' confidence intervals and an indicator of polarization or disagreement (PI), which is based on the variance of the DI.
Confidence Intervals
Confidence intervals can be constructed to address the inherent uncertainty associated with DIs as estimates. These intervals provide a range within which the true value of the underlying economic variable is likely to fall, given the DI's statistical properties. For example, consider the Richmond Fed's manufacturing employment DI, which tracks employment trends in the Fifth Federal Reserve District.
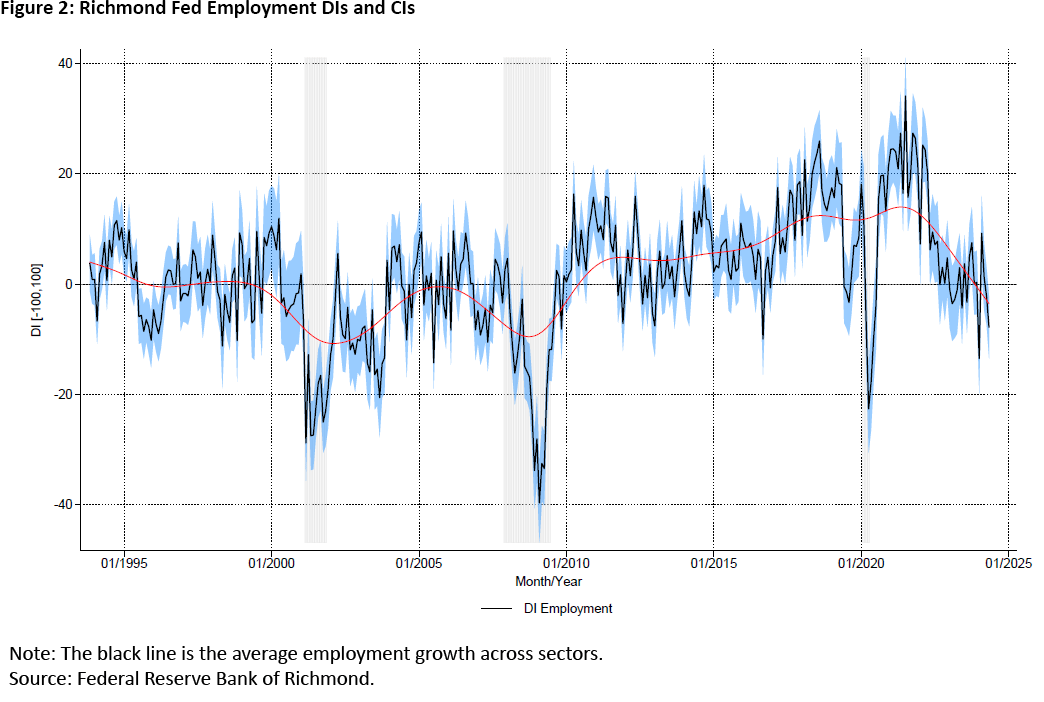
Historical data indicate that the DI is not statistically different from zero when its value lies between -4 and 4. This means that when the DI falls within this range, it is statistically indistinguishable from zero, making it difficult to draw firm conclusions about whether employment is expanding or contracting based solely on the DI. Using confidence intervals helps to contextualize the DI and to prevent overinterpretation of small fluctuations that might not be statistically significant.
Capturing Polarization: Leveraging the Variance of DIs
Instead of relying on the DI itself as a measure of disagreement, my 2020 paper "The Information Content and Statistical Properties of Diffusion Indexes" — co-authored with Pierre-Daniel Sarte and Robert Sharp — proposed a more nuanced approach: using the variance of the DI as an indicator of polarization or disagreement. This method acknowledges that a DI of zero can mask varying levels of disagreement among respondents. For example:
- A high variance around a DI of zero suggests greater polarization and diverse views on the direction of economic change. This might indicate uncertainty about the future path of the economy, as different firms or sectors experience varying conditions.
- A low variance around a DI of zero implies more agreement among respondents, which suggests a greater degree of consensus and a potentially more stable economic outlook.
Once again, consider the Richmond Fed's employment DI and the index's PI. The figure below compares the trends of the two indicators.
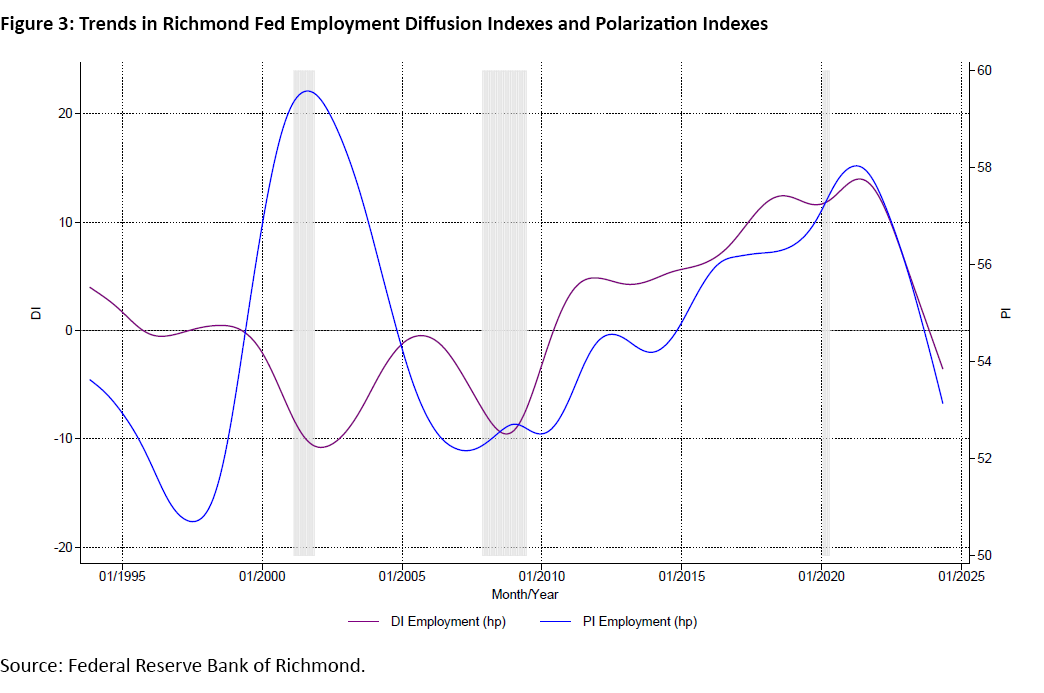
The graph shows that DI and PI fluctuated in opposite directions until 2010. However, they experienced a period of concurrent increase from 2010 to 2018, and they have both been declining since 2020. Therefore, incorporating DI variance into the analysis provides a more comprehensive understanding of the underlying dynamics driving the DI and avoids misinterpreting a seemingly stable DI that conceals a high degree of polarization.
Composite Diffusion Indexes
Many DIs are composite DIs, in the sense that they are weighted sums of individual DIs. Widely recognized examples of composite DIs include the University of Michigan's Survey of Consumers, the ISM Manufacturing Index and the Richmond Fed's Manufacturing Composite DI.
When working with composite DIs, the interpretation of polarization becomes more intricate, since it aggregates information contained in individual DIs that may fluctuate in different (and possibly conflicting) ways. Therefore, the overall level of disagreement reflected in a composite DI is influenced by not only the variance of each individual DI but also the covariance between them. This means that the extent to which disagreement across different individual DIs coincides plays a role in shaping the polarization of the composite DI.
Consider the case of a composite DI that combines three individual DIs and two possible situations.
High Polarization, Coincident Disagreement
If all three individual DIs exhibit high polarization, and the polarization tends to move in the same direction (high positive covariance), the composite DI will reflect a heightened level of overall polarization. This scenario suggests a widespread lack of consensus across different aspects of the economy, potentially signaling economic uncertainty.
High Polarization, Offset Disagreement
Conversely, if the individual DIs show high polarization but tend to offset each other (low or negative covariance), the composite DI might exhibit a lower level of overall polarization. This situation implies that while there might be disagreement within specific areas of the economy, these disagreements balance each other out at the aggregate level, potentially leading to a more stable overall outlook.
Therefore, analyzing the covariance between individual DIs is crucial for understanding how polarization manifests in composite DIs and for drawing accurate conclusions about the level of agreement or disagreement within the economy.
Diffusion Indexes and Consumer Sentiment
The Survey Research Center at the University of Michigan publishes three composite DIs:
- The Index of Current Economic Conditions (ICC)
- The Index of Consumer Expectations (ICE)
- The Index of Consumer Sentiment (ICS)
These indexes are key indicators of consumer behavior, which drives a significant portion of economic activity. Each monthly survey contains several core questions that track different aspects of consumer attitudes and expectations. Each month, a minimum of 500 interviews are conducted by telephone, with data available since 1978. The samples for the Surveys of Consumers are statistically designed to represent all American households.
The indexes emphasize distinct aspects of how consumers perceive economic conditions. The ICC emphasizes current household financial conditions and views on purchasing conditions for durable goods and other big-ticket items. The ICE examines how households perceive their financial prospects, the general economy over the short term and the general economy over the long term. The ICS aggregates information from both indexes and serves as an overall measure of consumer confidence.3
Figure 4 shows several readings based on the ICC: We construct confidence intervals for each individual DI and develop an index of polarization for each DI. We also construct confidence intervals and a PI for the composite ICC.

Notably, the individual DIs evolve similarly over time, while PIs behaved differently during the period 2003-2014. Since 2022, all of the DIs and PIs based on the Survey of Consumers have been increasing. The main driver of polarization in the ICC is the variance of the survey question that tracks consumer attitudes towards buying durable goods and big-ticket items. Recently, polarization has been at its highest levels, characterized by the high variance of the DI associated with that question (which is typical after recessions) and a higher covariance between the DI that tracks changes in consumers' current financial conditions and the DI that tracks consumer attitudes toward buying durable goods and big-ticket items.
We also construct confidence intervals and PIs for the ICE and ICS, and we examine their respective trajectories, as seen in Figure 5.
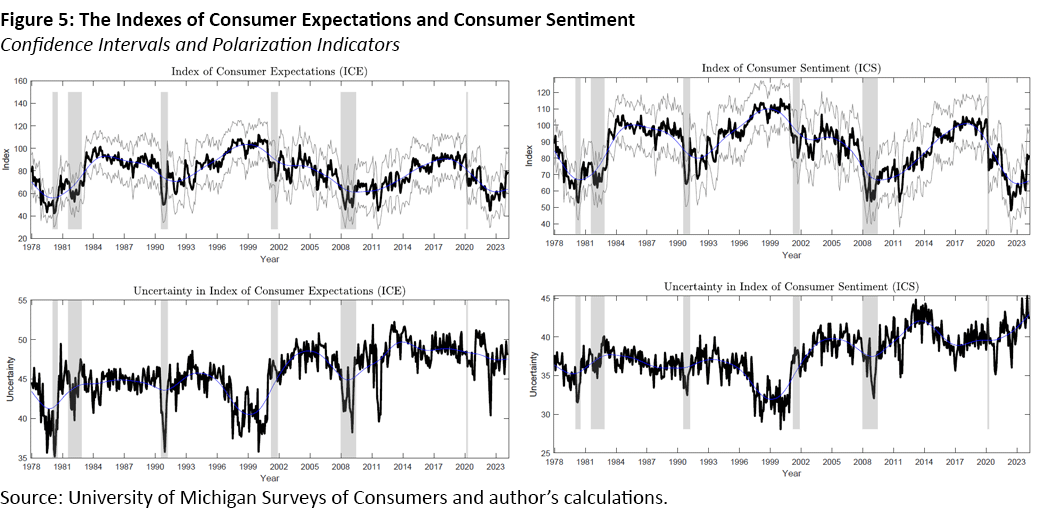
Focusing on the recent period, we can discern several key insights from these graphs. Before the pandemic, both ICE and ICS were on the rise, while the PI remained steady. ICE and ICS initially declined during the pandemic, but they have been rising since 2022, this time accompanied by an increase in the PI.
The table below compares the confidence intervals for ICC, ICE and ICS across different periods to analyze changes in their variability or uncertainty.
| Series | January 1978-February 2020 | March 2020-March 2024 | January 1978-March 2024 |
|---|---|---|---|
| ICC | ±4.29 | ±4.41$ | ±4.30$ |
| ICE | ±4.22$ | ±4.08$ | ±4.21$ |
| ICS | ±3.47$ | ±3.47$ | ±3.47$ |
| Source: The University of Michigan's Survey of Consumers and author's calculations. | |||
The table shows that the confidence intervals for ICC and ICE experienced some variation between the two periods. The confidence interval for the ICC increases slightly in the most recent period, indicating potentially greater variability or uncertainty during this time. The ICE confidence interval decreases slightly during the most recent period, suggesting a minor reduction in variability or uncertainty. The ICS confidence interval remains constant across all periods, indicating stable levels of consumer sentiment. This suggests that while some indexes have experienced changes in uncertainty, overall consumer sentiment (ICS) has remained steady.
Finally, we compare our PI to existing measures of uncertainty, financial volatility and political polarization:
- Economic policy uncertainty — measured by the Economic Policy Uncertainty Index — experienced a similar evolution to that of ICC, with different behavior since 2020.
- Macroeconomic uncertainty — represented by the JLN uncertainty measurement — and ICC polarization behave similarly.4
- Movement in the Partisan Conflict Index is closely related to movements in ICE and ICS polarization: Indicators increased between 2008 and 2014, moved in opposite directions between 2014 and 2020 and have shown an increasing trend since 2020.
- Our polarization indicators and the Chicago Board Options Exchange Market Volatility Index (commonly referred to as VIX) do not seem to move closely together.
Conclusion: DIs as Powerful Tools With Essential Caveats
DIs are widely used as tools for analyzing economic trends and understanding the breadth of change across various economic variables. Their ability to measure the "how many" aspect of economic activity offers valuable insights into the direction and prevalence of specific trends. However, DIs alone can present an incomplete and potentially misleading picture, particularly when analyzing variables primarily driven by the "how much" margin or when interpreting the information content of a given value of the DI.
By incorporating confidence intervals and PIs into DI analysis, we can address these limitations and gain a more comprehensive understanding of economic trends and the uncertainty surrounding them. Confidence intervals provide a measure of statistical significance, helping to avoid misinterpretations of small fluctuations in the DI. PIs, in turn, reveal the level of disagreement or polarization among survey respondents, offering crucial insights into potential vulnerabilities or divergent trends even when the DI suggests stability.
This enhanced approach to DI analysis has significant implications for policymakers, analysts and market participants. By considering the statistical properties of DIs and the potential for variability, we can make more informed decisions based on a more accurate assessment of the data. As we navigate an increasingly complex and uncertain economic landscape, the ability to understand and interpret DIs effectively will be crucial for making sound judgments and promoting sustainable economic growth.
Santiago Pinto is a senior economist and policy advisor in the Research Department at the Federal Reserve Bank of Richmond.
To cite this Economic Brief, please use the following format: Pinto, Santiago. (February 2025) "Understanding Diffusion Indexes: Insights and Applications." Federal Reserve Bank of Richmond Economic Brief, No. 25-05.
1
They are used by organizations around the world, including many central banks (such as the Federal Reserve), government agencies (such as the Bureau of Labor Statistics and Census Bureau) and trade groups (such as the National Association of Home Builders and the Institute for Supply Management).
2
DIs are also used to track changes in business conditions. The ISM Manufacturing Index, for instance, is one of the most closely watched indicators of manufacturing activity and is often used as a leading indicator of overall economic performance.
3
The core questions contained in the survey cover household financial conditions (changes from the previous year and expected change a year from now), current state of the economy (business conditions better or worse than a year ago), expected state of the economy (business conditions for next five years) and household's perceptions of buying conditions for durable goods and other big items. The answers are aggregated into five individual DIs: D1 (household financial conditions change from previous year), D2 (household financial conditions expected change in one year), D3 (current state of the economy), D4 (expected state of the economy) and D5 (household perceptions of buying conditions). The composite indexes are constructed based on these individual DIs as follows: ICC = (D1 + D5)/2.6424 + 2, ICC = (D2 + D3 + D4)/4.1134 + 2, and ICC = (D1 + D2)/6.7558 + 2.
4
The construction of the JLN uncertainty measurement is discussed in the 2015 paper "Measuring Uncertainty" by Kyle Jurado, Sydney Ludvigson and Serena Ng.
This article may be photocopied or reprinted in its entirety. Please credit the author, source, and the Federal Reserve Bank of Richmond and include the italicized statement below.
Views expressed in this article are those of the author and not necessarily those of the Federal Reserve Bank of Richmond or the Federal Reserve System.
Subscribe to Economic Brief
Receive a notification when Economic Brief is posted online.
Contact Us